Introduction
One of the most important aspects of using our sensors is defining a rule-set for the sensor, and receiving notifications when measured values are outside their limits.
This article will show you how to set up a new rule for a sensor within your system.
Create new Rule
Start by navigating to the "Rules" settings in your navigation menu.
.png)
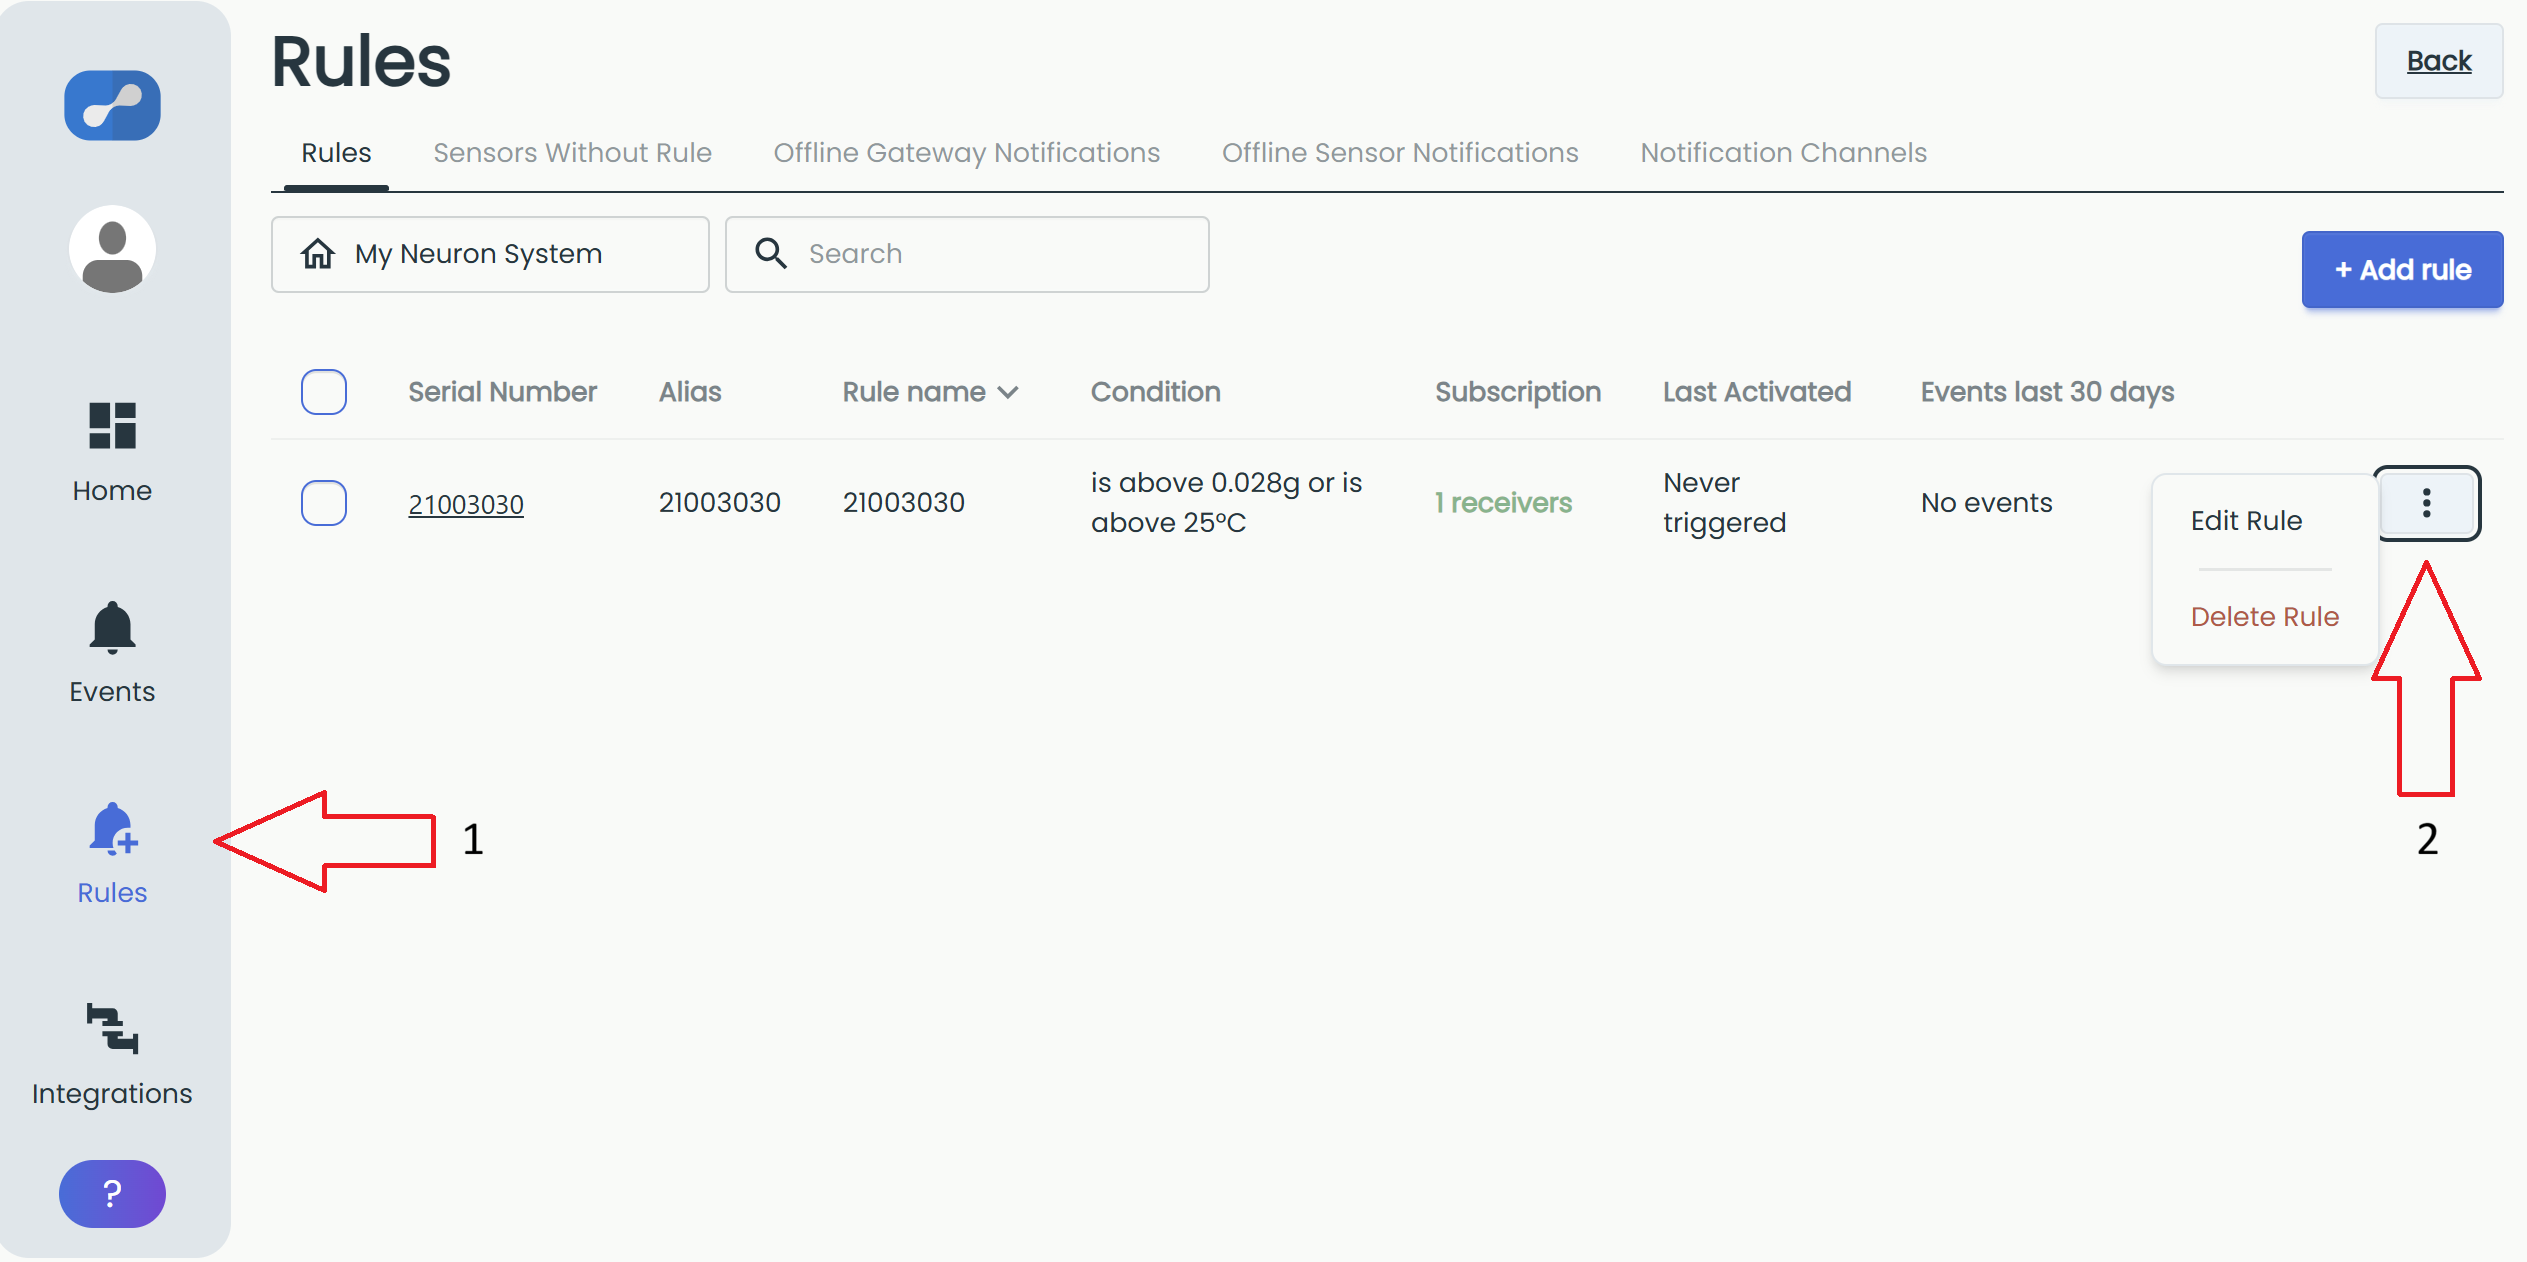
This will open up the rules settings menu.
Start by selecting which system the relevant sensor belongs to.
If rules exist for the selected system, they will display under the 'Rules' tab.
Click on the + Add rule button to define a rule.
.png)
The Sensors Without Rule tab lists all sensors in the system that do not yet have a rule, so you can quickly spot what still needs configuring.
Configure the rule
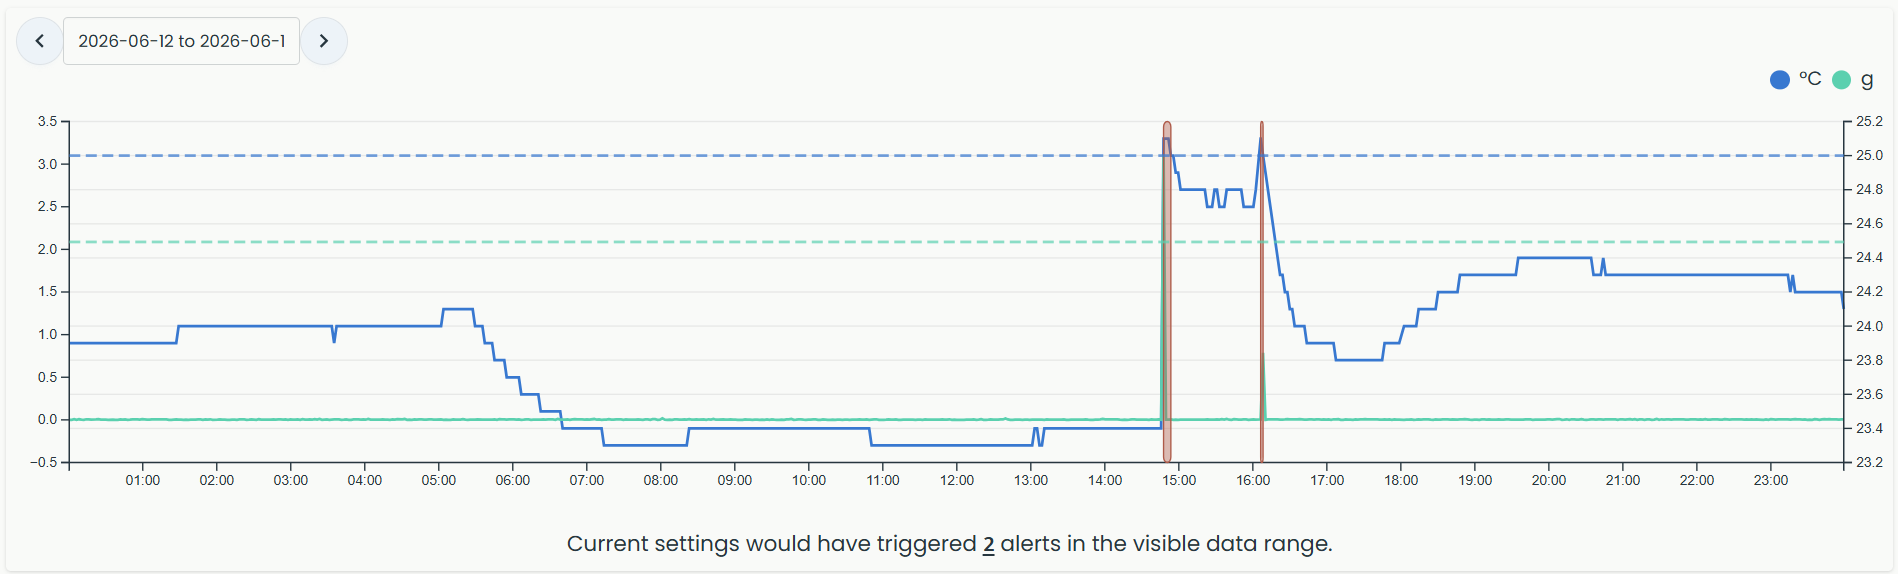
Chart: A chart with data from the selected time range assists you in setting the rule. It also shows how many alerts your current settings would have triggered within the visible range.
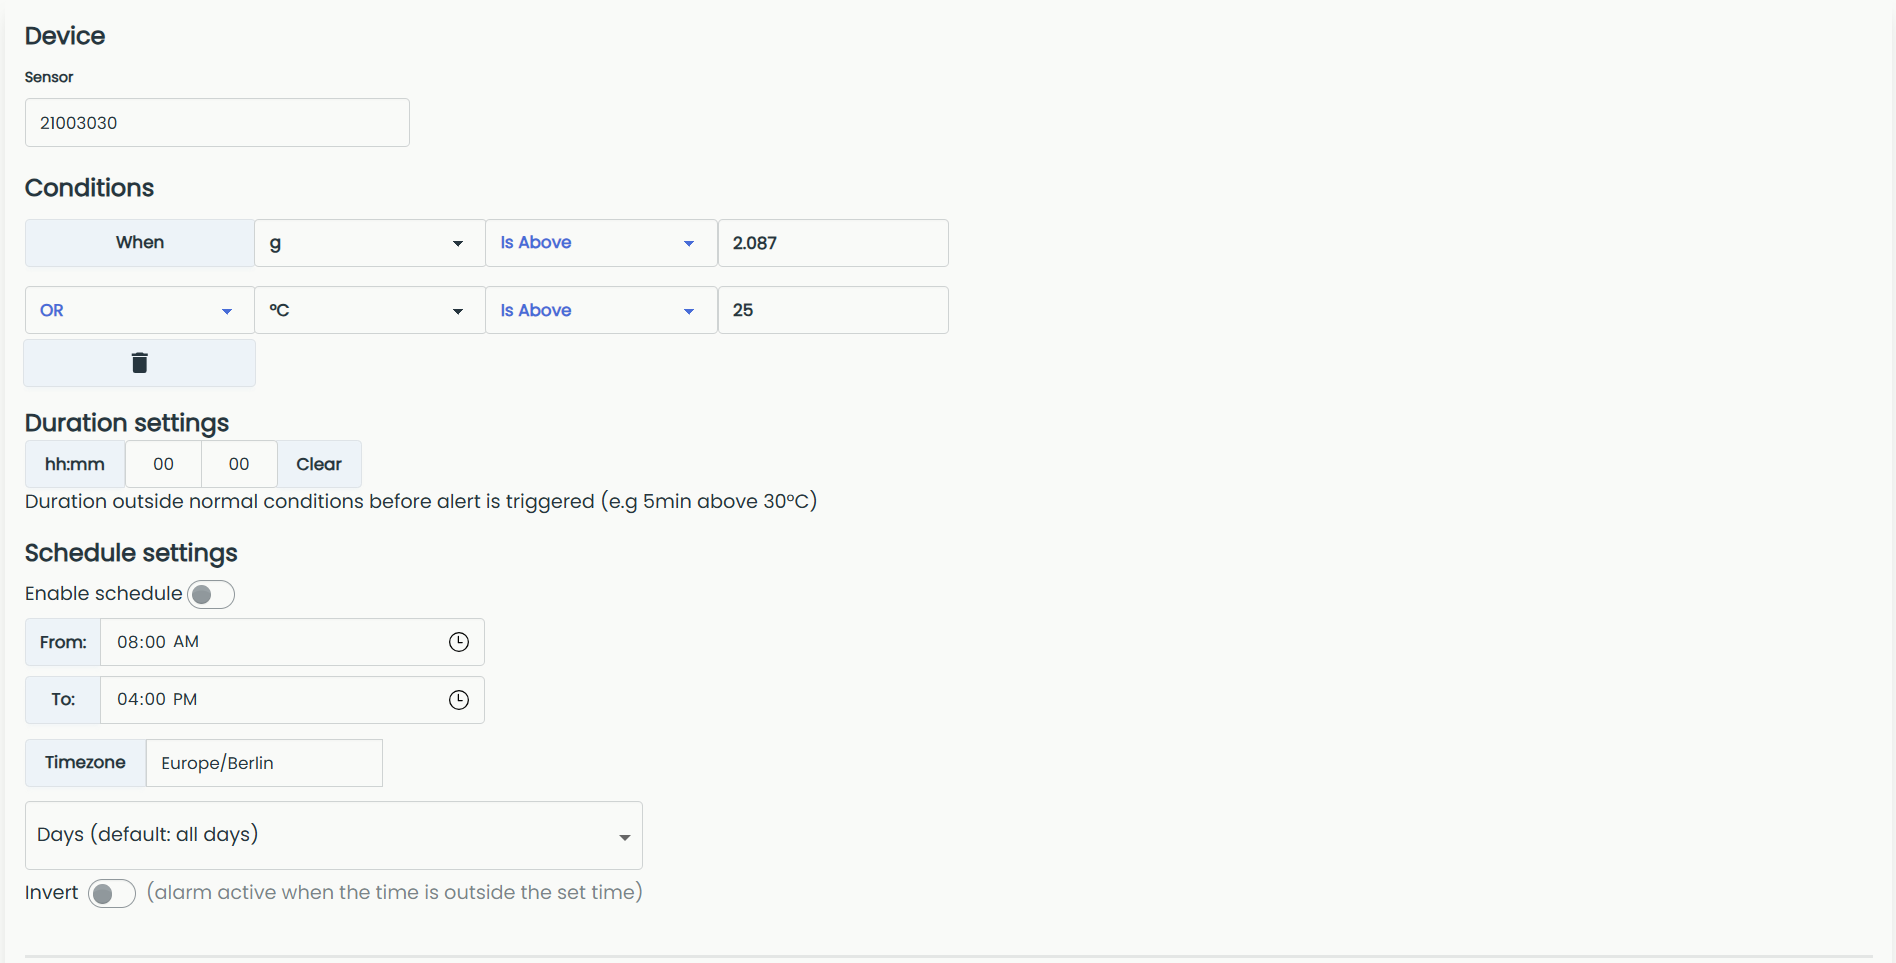
Device
- Sensor: Select the sensor the rule should apply to.
Conditions
- Unit: A dropdown of the measurement units available for the selected sensor (for example °C or g).
- Operator: Defines how the measured value is compared to the limit (for example Is Above or Is Below).
- Limit: The value the measured data must reach for the condition to be met.
- Comparator (AND/OR): When you add more than one condition, the comparator defines the logical relationship between them that must be true before the rule triggers an alarm.
Duration settings: Lets you define a duration of time the sensor value has to be outside the 'normal' range in order for the rule to trigger.
Schedule settings: Define when the rule should be active.
- Enable schedule: Turns scheduling on or off.
- From / To: The time window during which the rule is active.
- Timezone: The time zone the schedule follows.
- Days: The days the rule is active (default: all days).
- Invert: When enabled, the alarm is active when the time is outside the set window instead of inside it.
Notifications
- Rule name: Give your rule a descriptive name.
- Custom event message: A message included in the notification sent to receivers.
- Event receivers: Choose the Notification Channels to notify when the rule triggers. If left empty, no one will be notified of the alert.
- Send SMS alerts: This toggle is no longer active. SMS is now sent through the Event receivers list above. Add the relevant Notification Channels there to send SMS. See Notification Channels for more info.
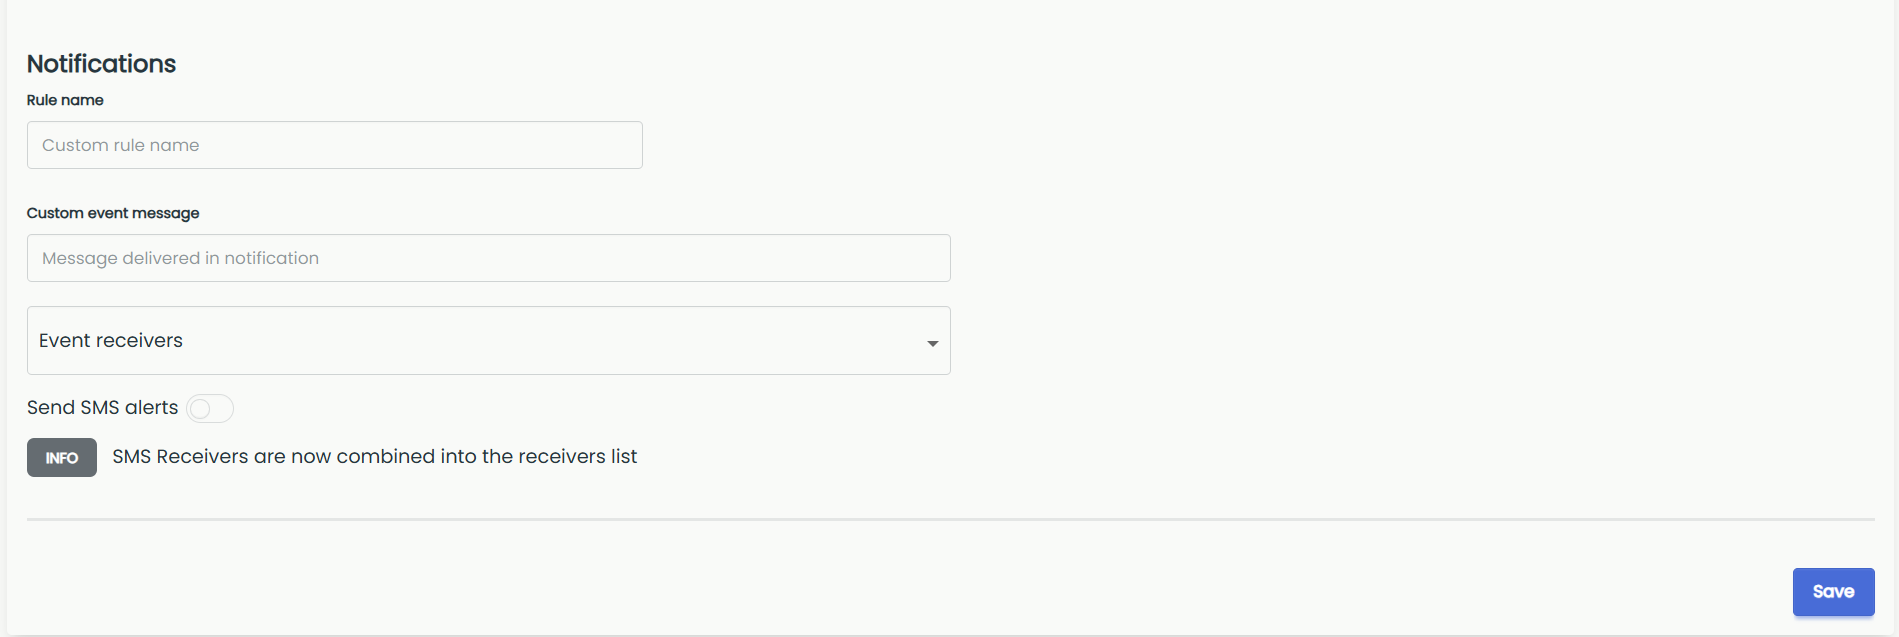
When you are happy with the rule, click Save.
SMS alerts will add an additional cost of €0.40 per SMS sent.
At most one SMS alert will be sent to all receivers per hour.
Offline Gateway Notifications
Offline notifications for gateway can be selected to get notified if a gateway was offline for more than 60 minutes.
This is very helpful to determine if the gateway has lost power, needs a power reset or has some other issues that prevent it from sending sensor data to Neuron Cloud.
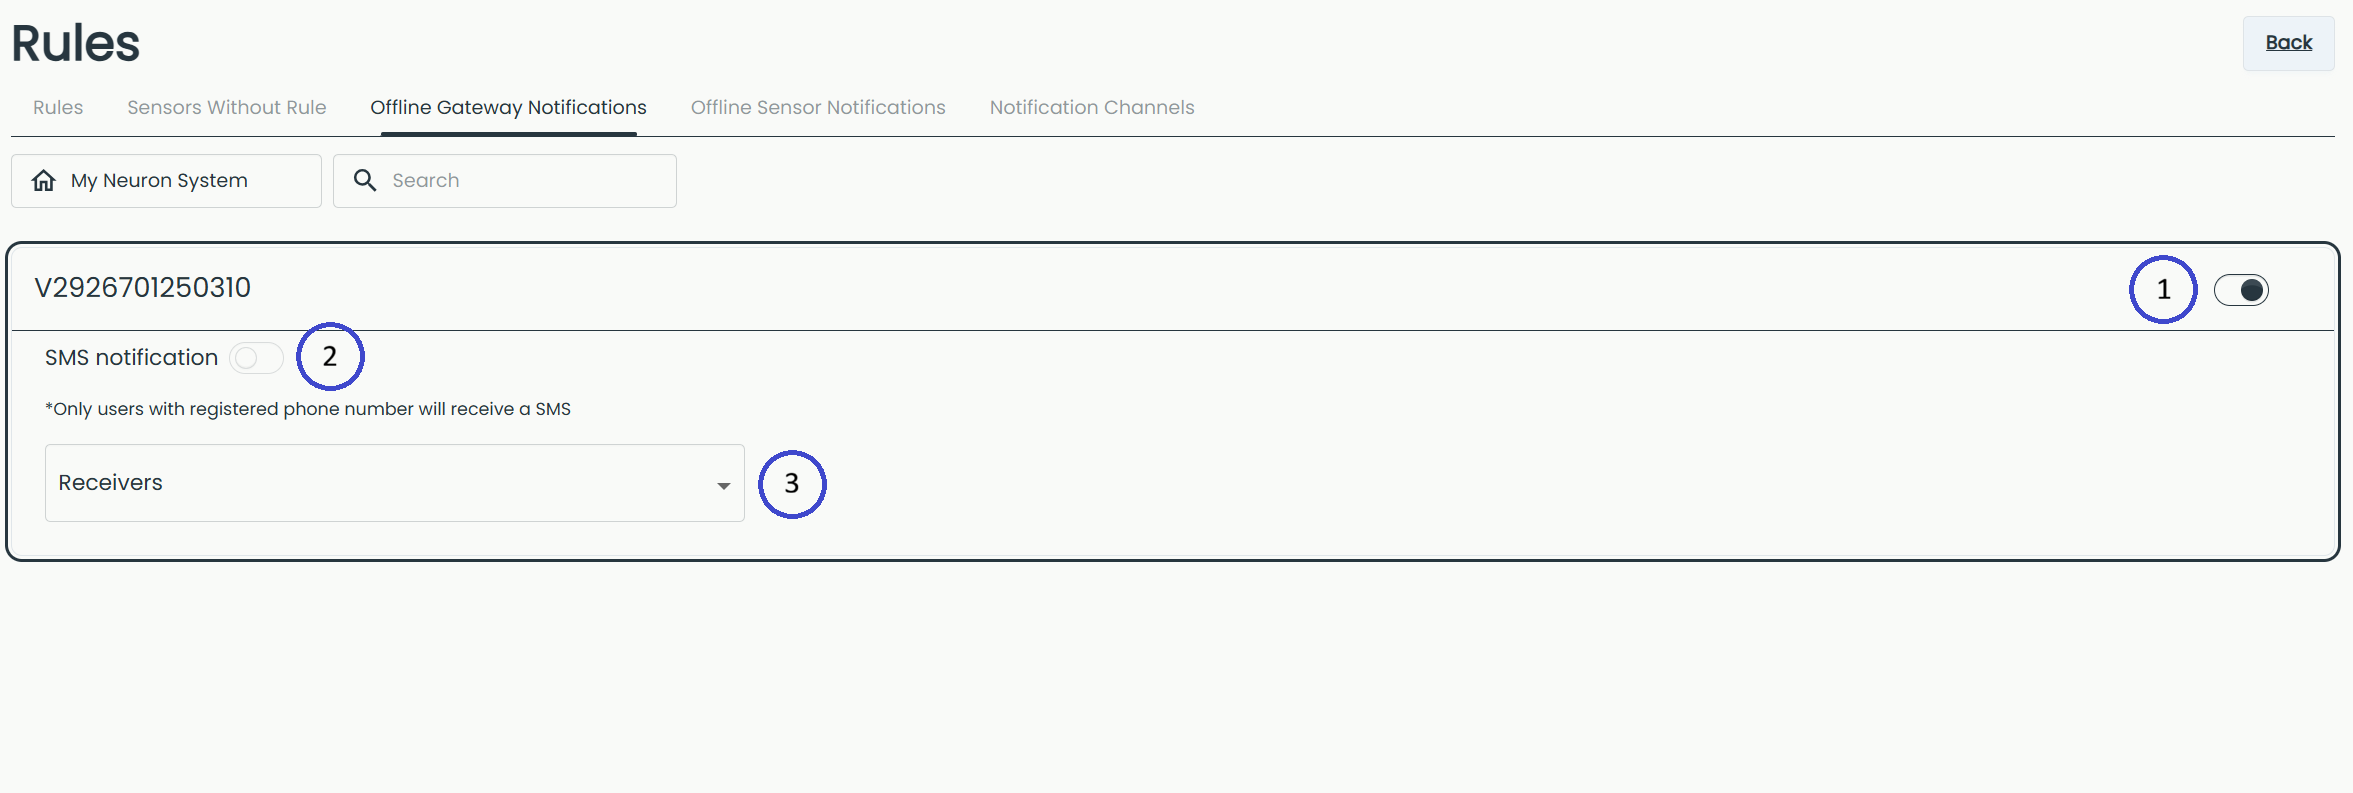
- Enable offline notifications: turn on offline notifications for this gateway.
- SMS notification: enable to also send an SMS (only users with a registered phone number will receive it).
- Receivers: choose which Notification Channels to notify.
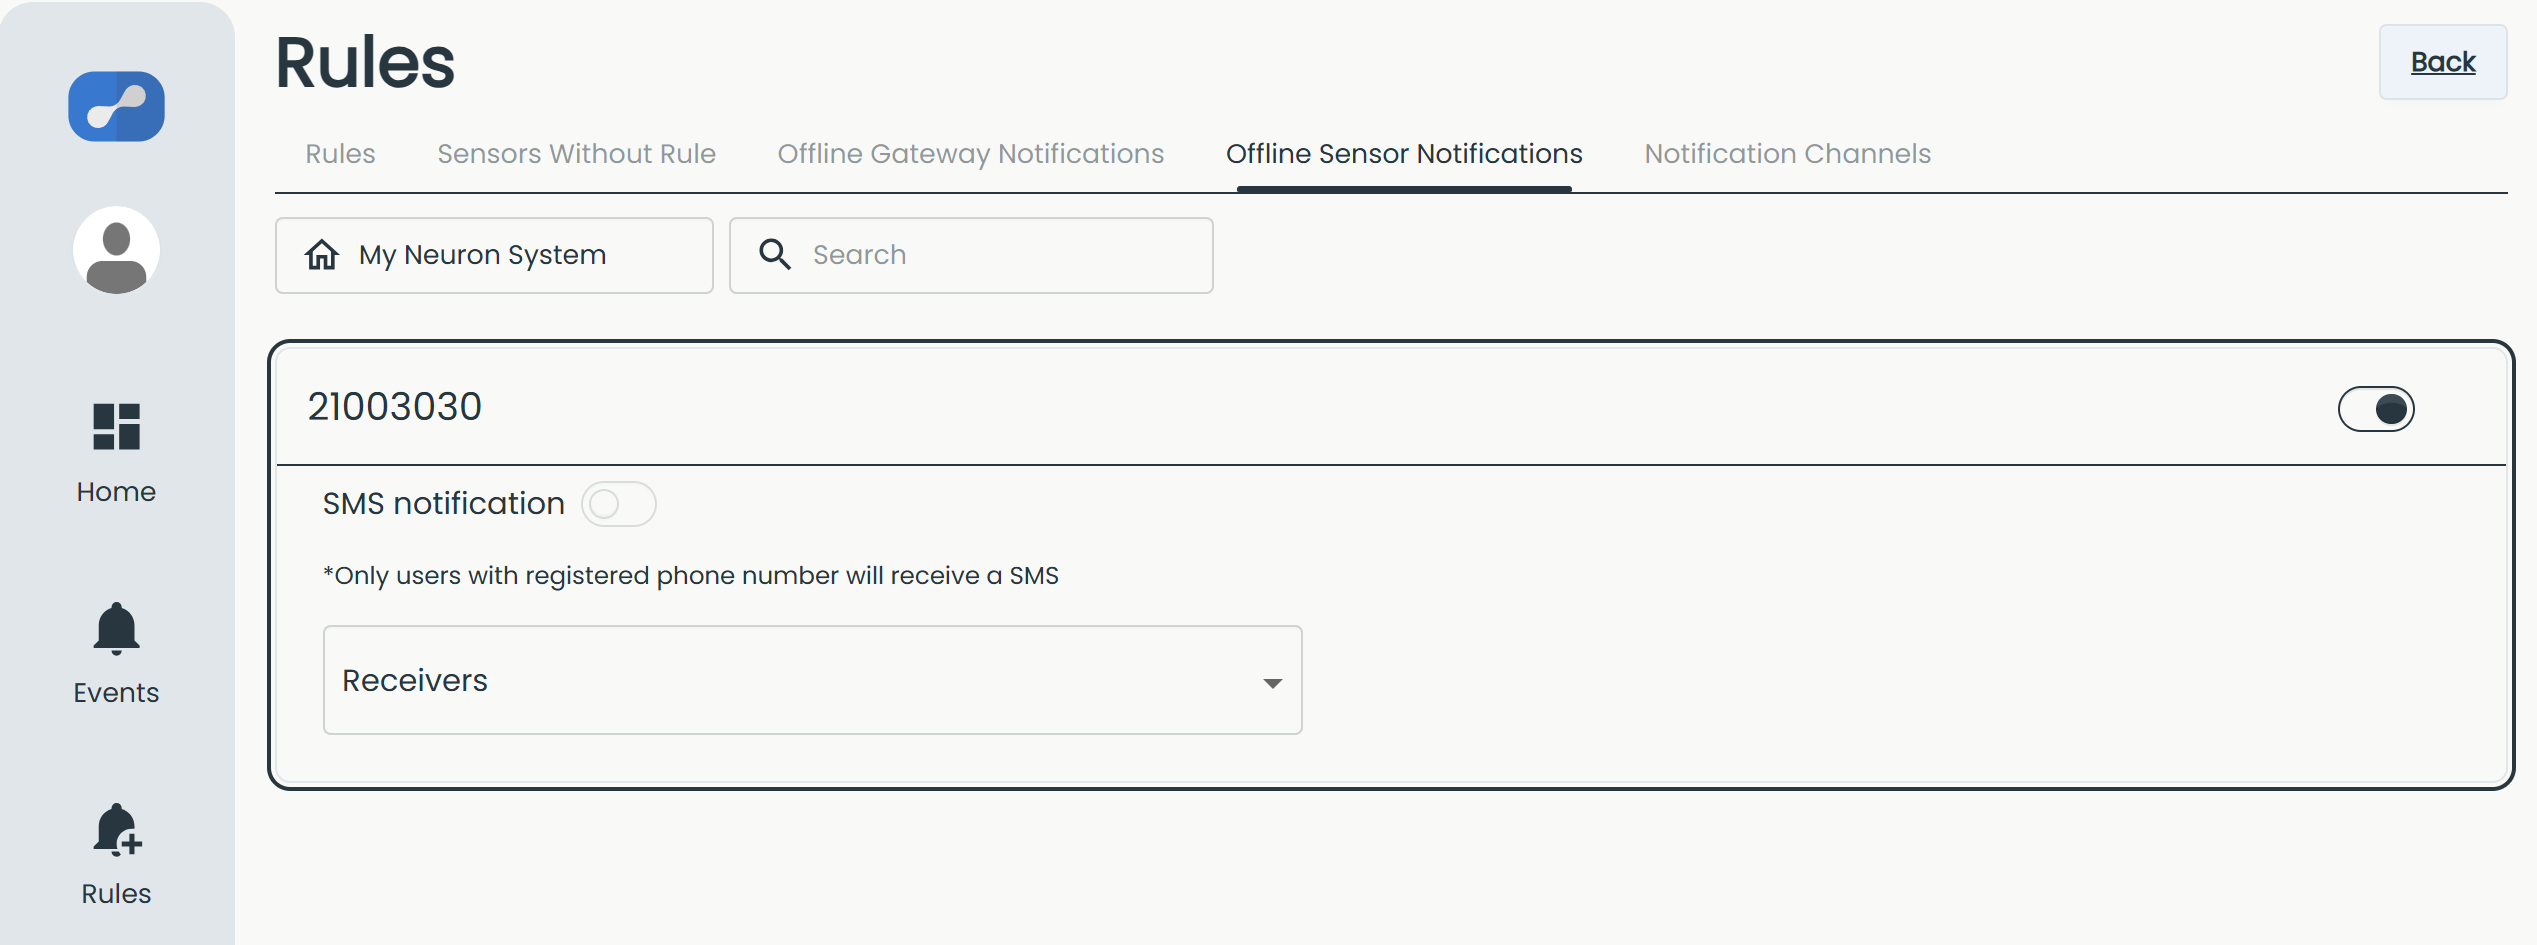
Offline Sensor Notifications
Offline sensor notifications work the same way as for gateways, but apply to individual sensors. Enable them to get notified if a sensor stops sending data — for example because of a depleted battery, a sensor that is out of range, or another issue preventing it from reaching a gateway.
Alarm Event
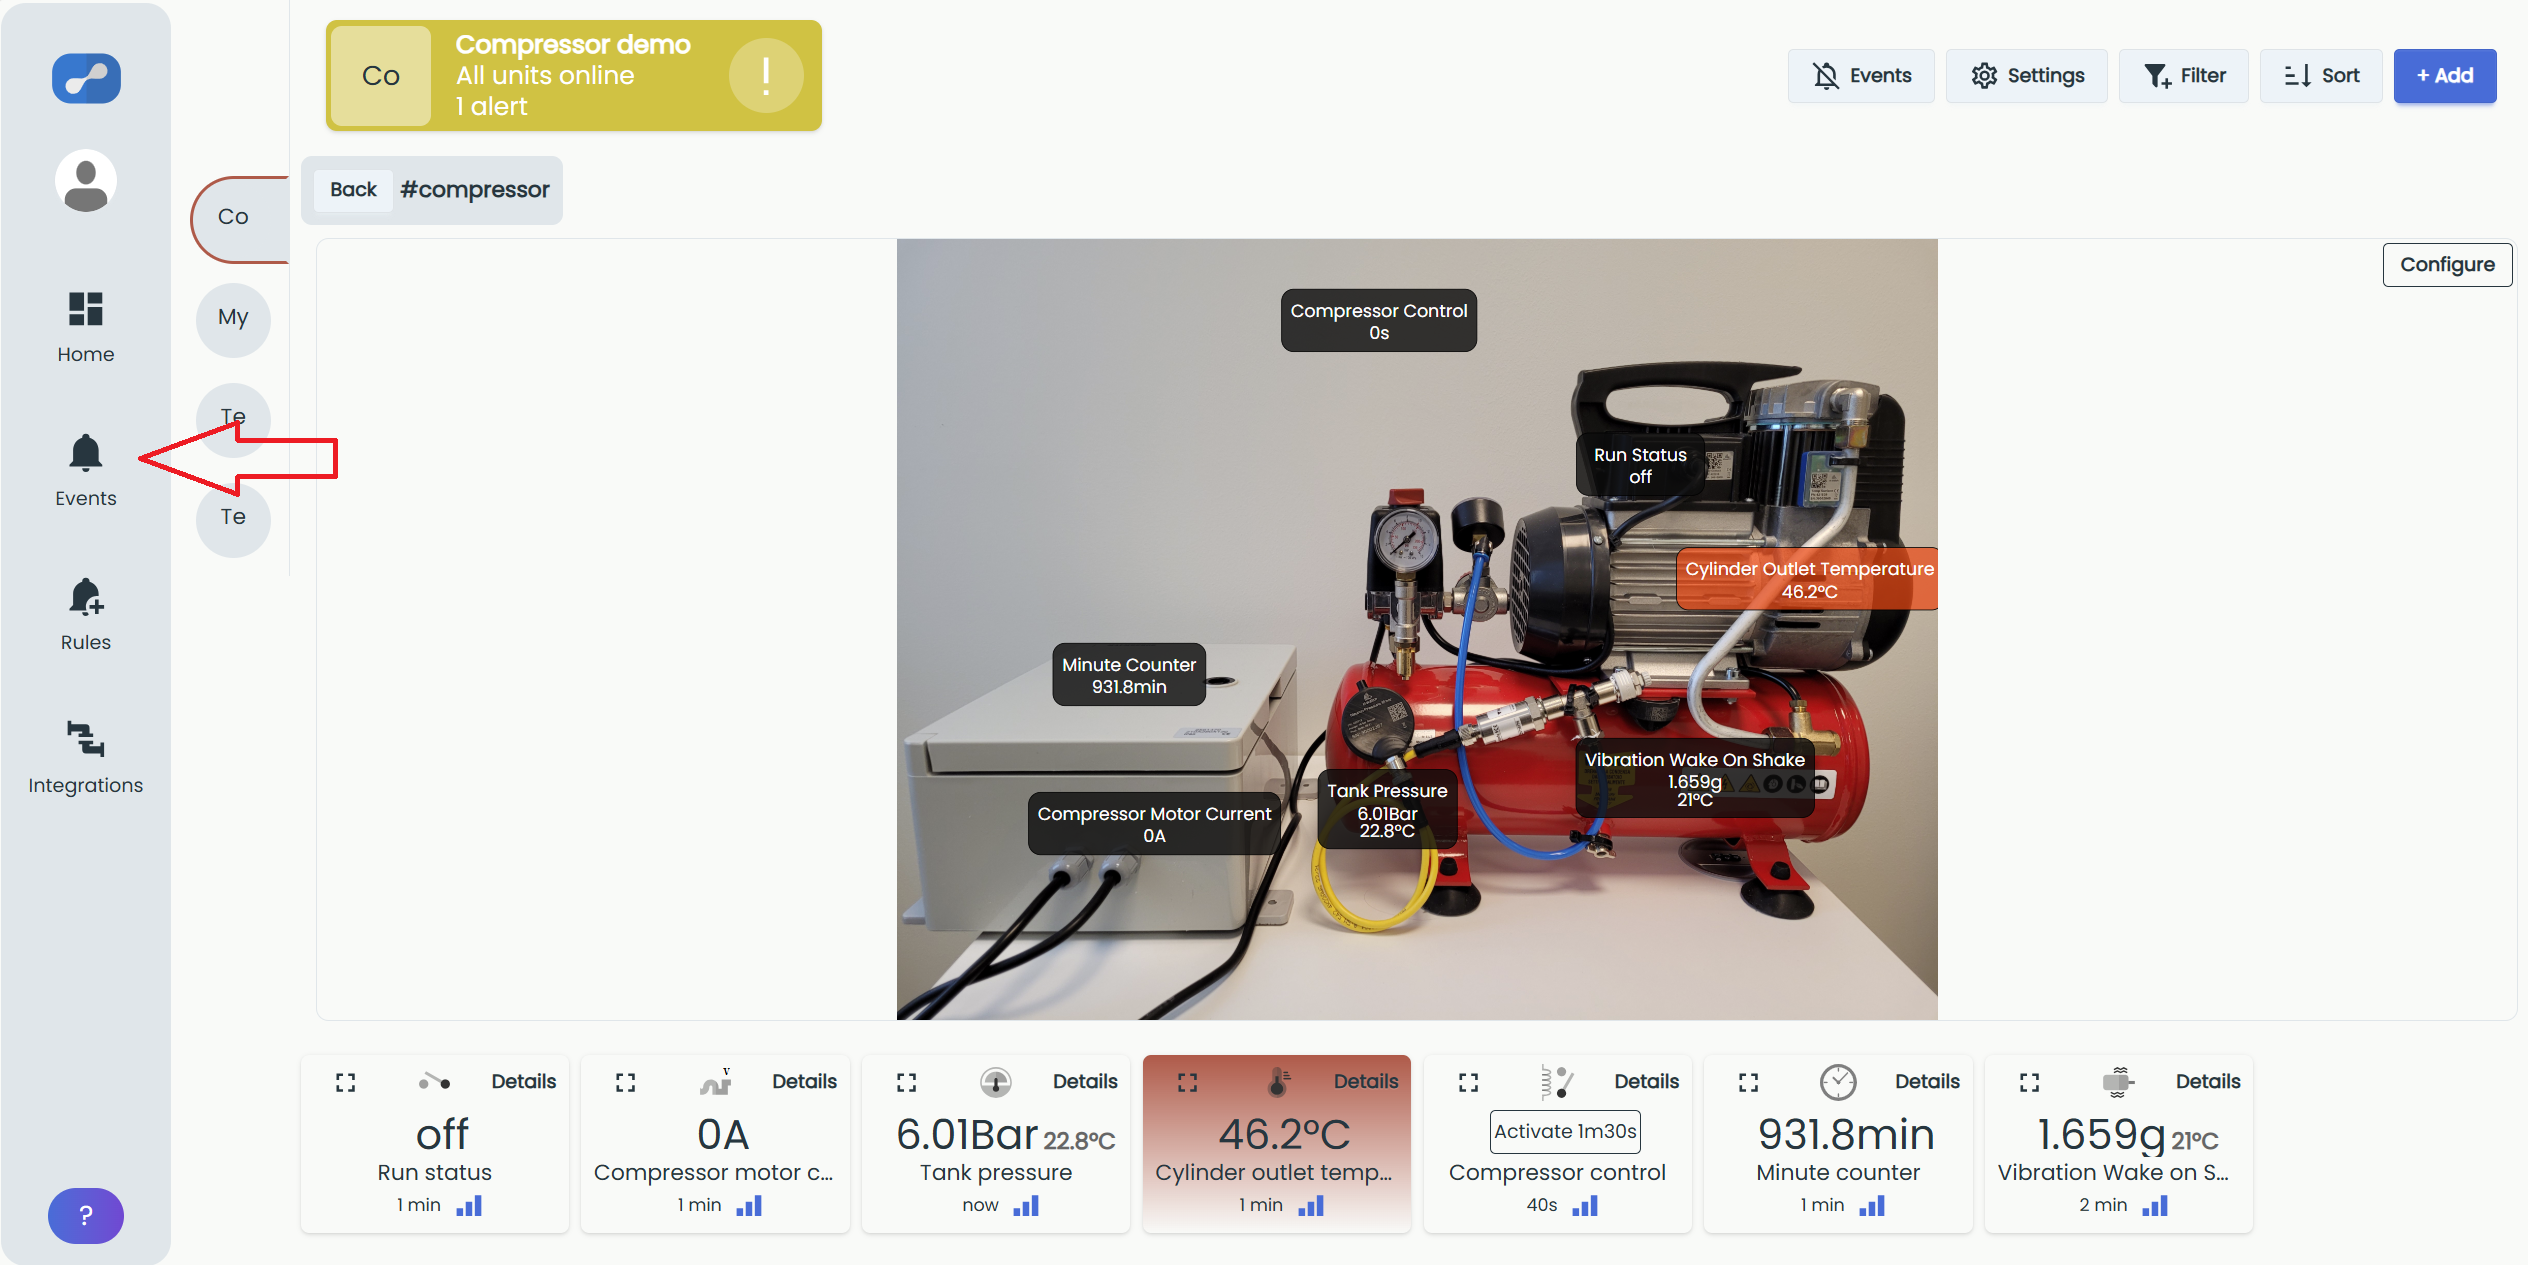
When one of your sensors triggers an alarm, its tile changes color to orange, and the system header shows the number of active alerts. In the example below, the Cylinder outlet temperature tile has turned orange because its value went outside the configured limit.
To see what happened, go to Events in the left menu (see red arrow).
The Events list shows every event registered for the selected system. For each event you can see when it occurred, which rule triggered it, the event message, and its severity. Use the filters at the top to narrow the list by date range, device, or event type.
Click Details on the relevant event to open it (see red arrow).
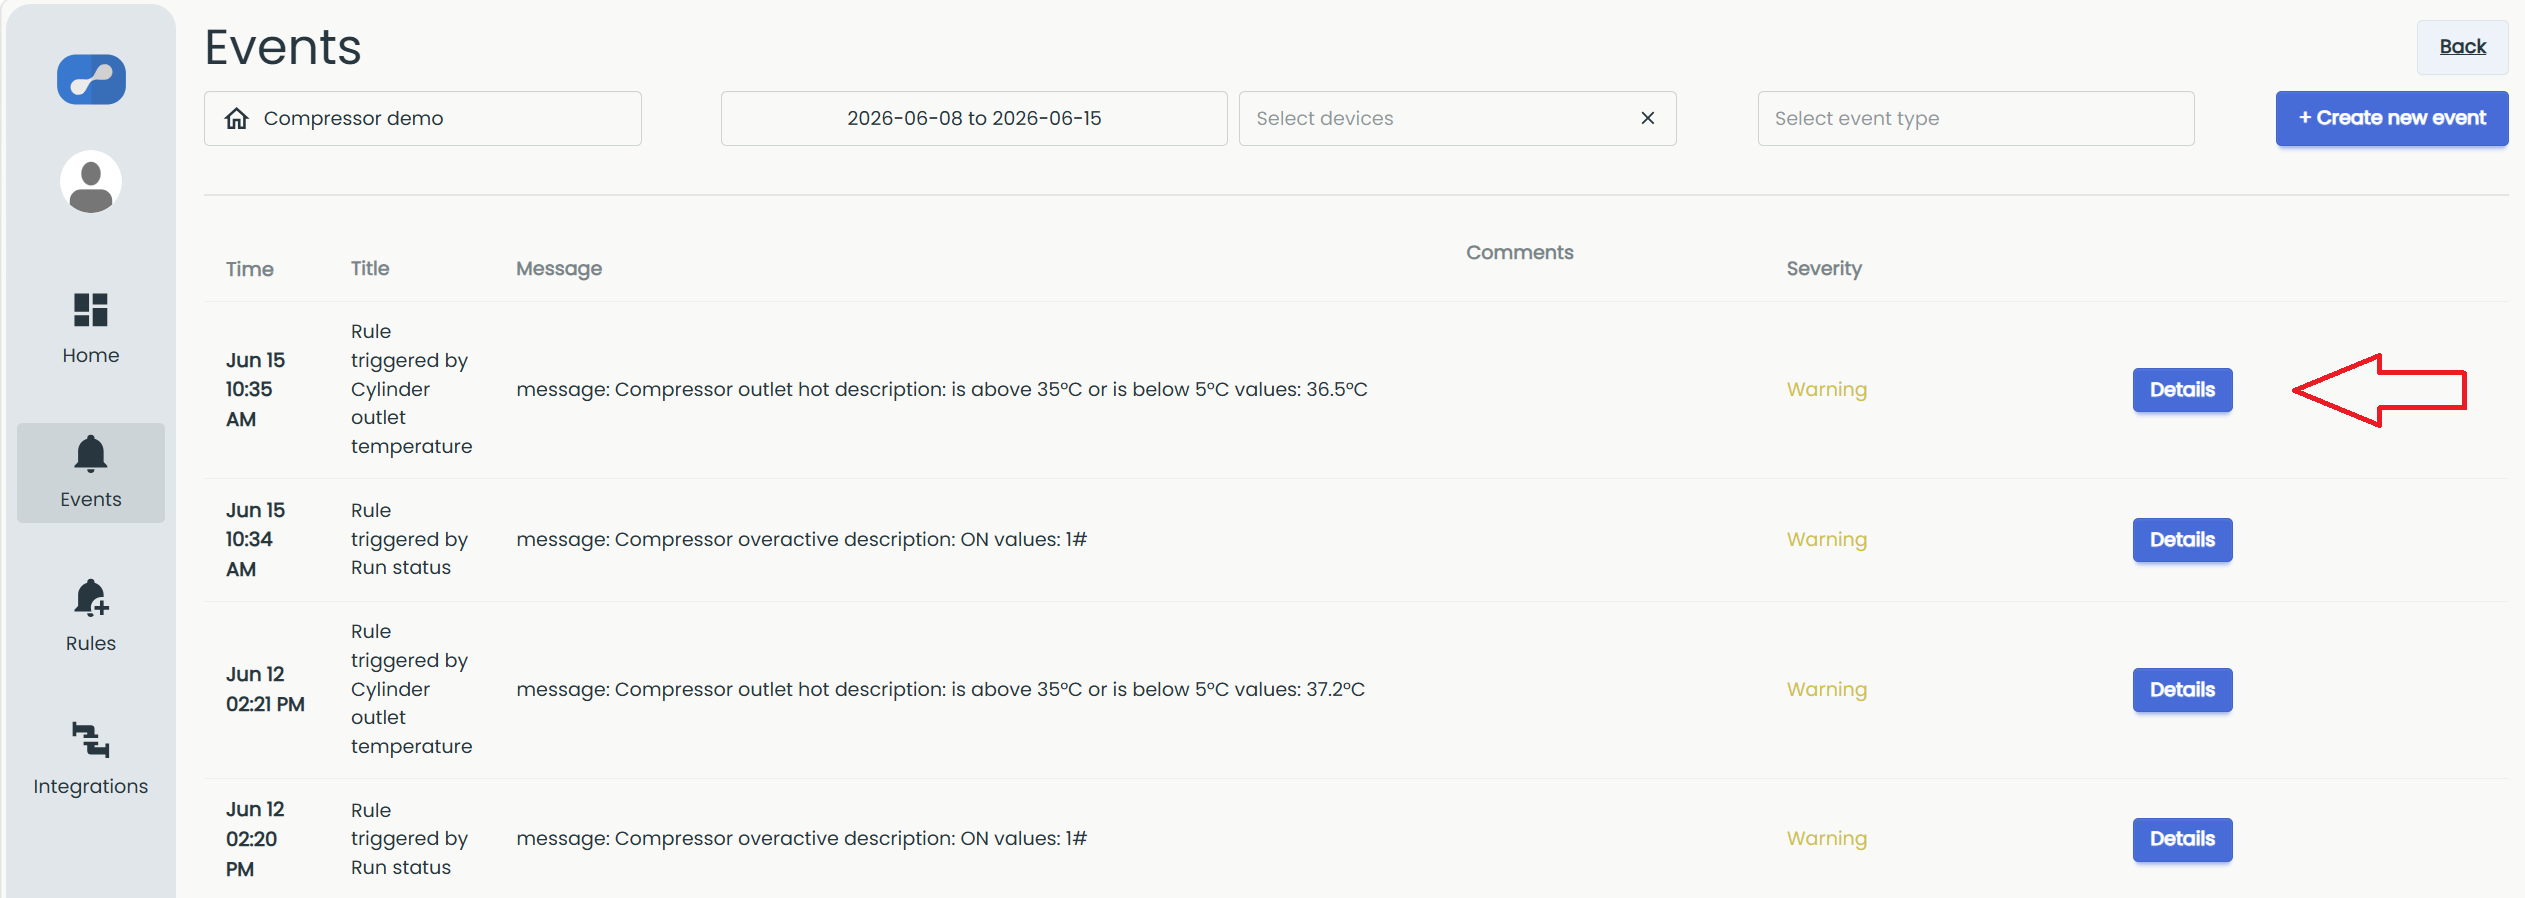
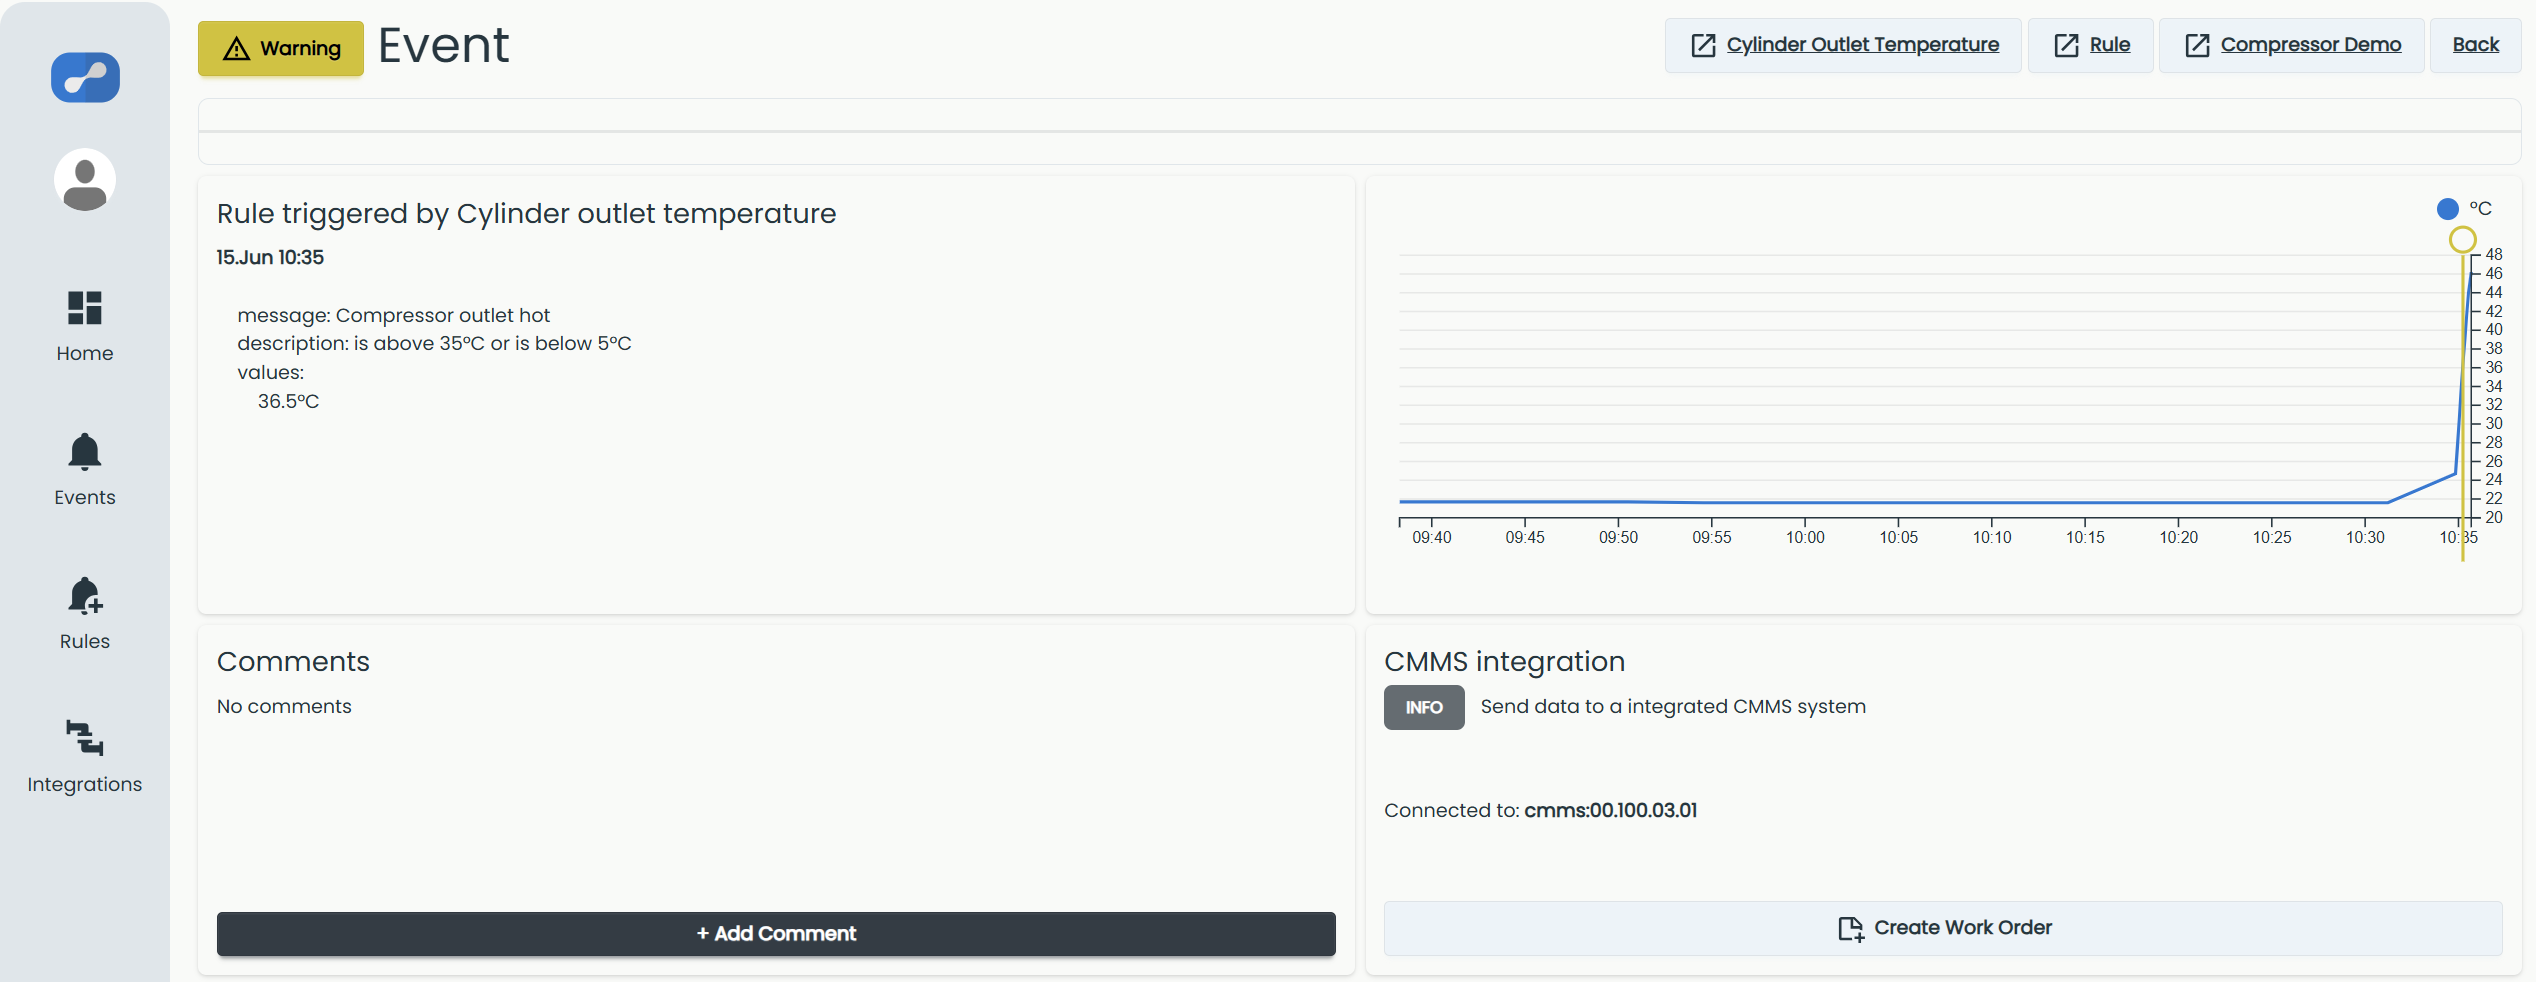
The event view gives you the full context of what triggered the alarm: the rule that fired, the condition that was breached, and the measured value at that moment. In this example, the cylinder outlet temperature reached 36.5 °C, breaching the "above 35 °C" condition. The chart shows how the value developed around the time the rule triggered.
From here you can also add a comment for your colleagues, and if the system is connected to a CMMS, you can create a work order directly from the event.
Edit or delete rule
Go to the Rules tab in the left menu (1). Find the rule you want to change and click the three-dot menu (⋮) on its row (2). From here you can choose Edit Rule to change its settings, or Delete Rule to remove it.