Overview
The sensor details view gives you the full picture of a single sensor: its current status and metadata at the top, and an interactive chart of its historical data below. From here you can also compare it with other sensors, filter and zoom the data, and export it.
Sensor details
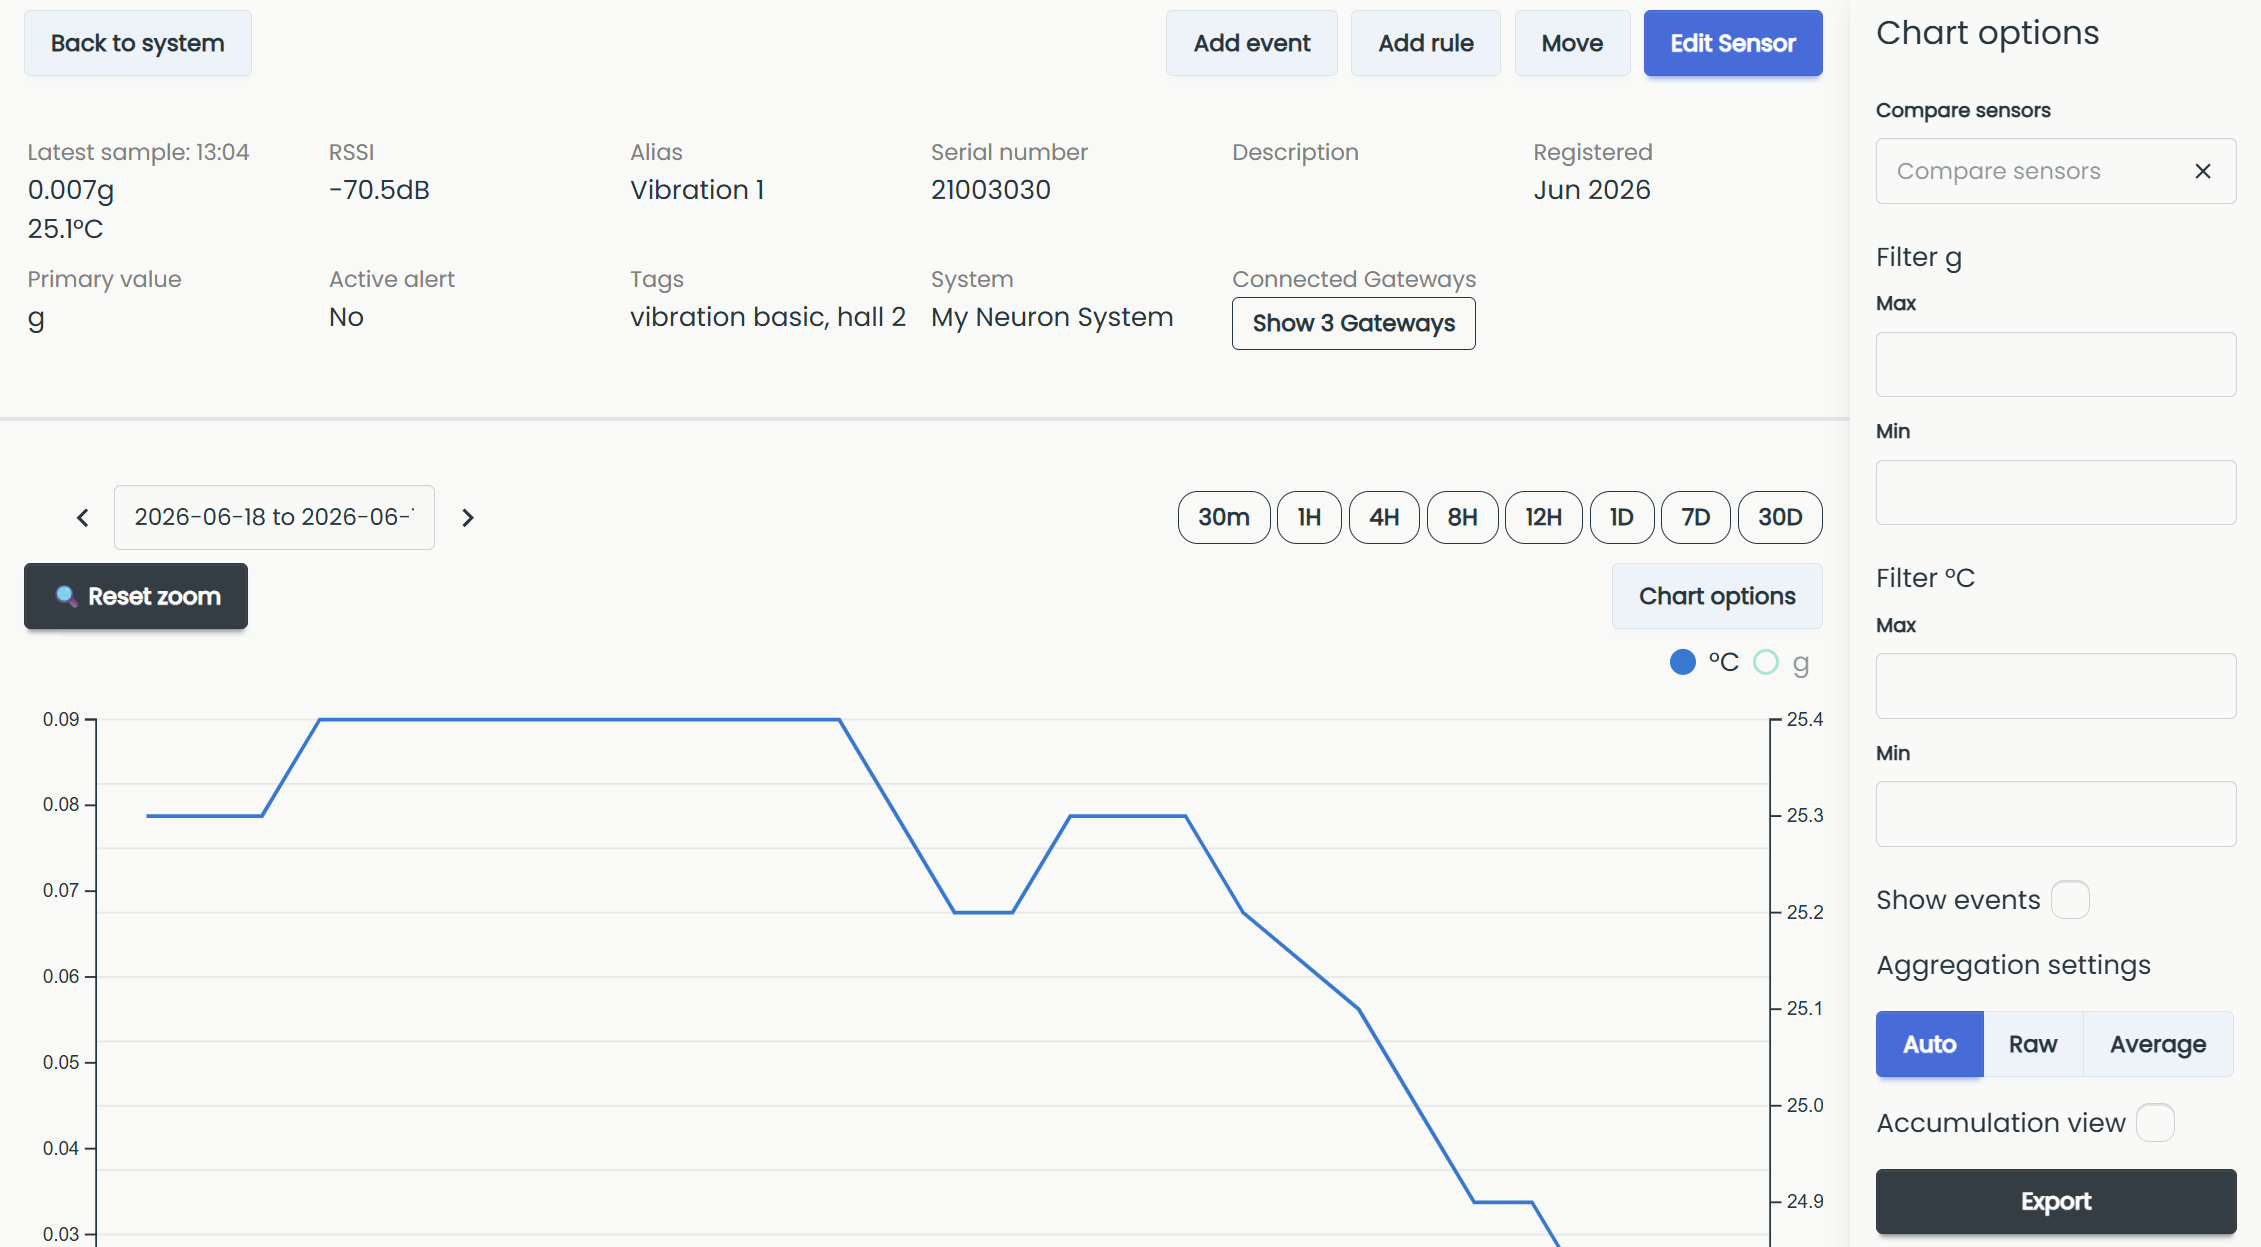
From inside a system, click "Details" on a sensor tile to open the sensor details page. The sensor details page shows current sensor information at the top and historical sensor values in the chart below.
.png)
From the buttons at the top you can add an event or a rule, edit the sensor, or use Move to transfer the sensor to a different system.
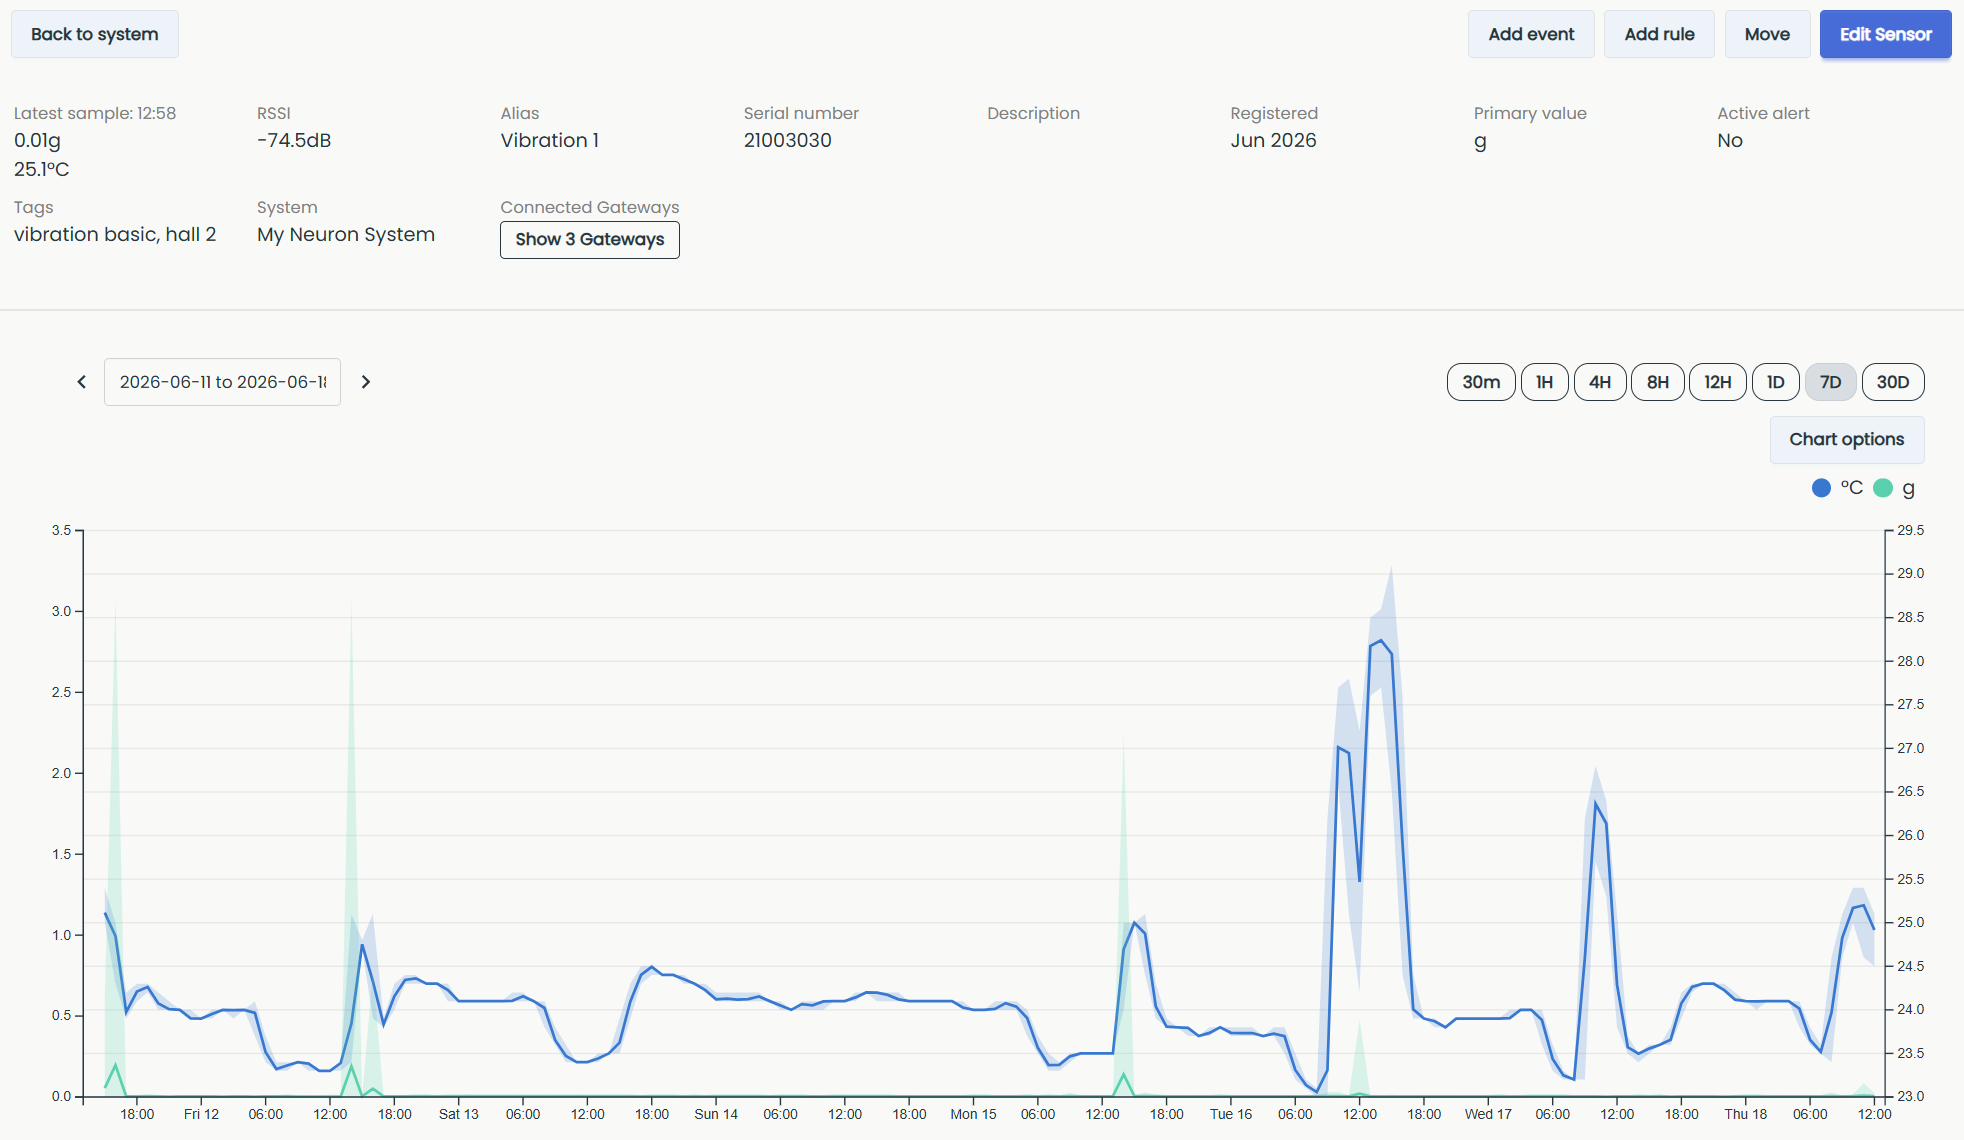
The information panel at the top of the sensor details page includes the following fields:
Latest sample: The latest received value and the time it was received.
RSSI: Signal strength between the sensor and gateway, shown in dBm. A higher (less negative) value means a stronger connection. Read more about installation and dBm here.
Alias: The sensor name used in your system. Choose a name that makes the sensor easy to identify.
Serial number: The sensors unique serial number.
Description: A brief description of the sensor's purpose, which makes it easier to recall later.
Registered: The date the sensor was registered in the system.
Primary value: The value shown as the main value on the sensor tile. For sensors with multiple values, this can be changed in Edit Sensor.
Active alert: Shows whether an alert or event is currently active for the sensor.
Tags: Labels used to organize sensors and build groups and rules.
System: The parent system. Click the system name to open the system view.
Connected Gateways: Gateways the sensor has reported through. Click "Show ... Gateways" to view them.
Sensor image: If an image has been added, click "Show" to view the picture of the installed sensor.
If no image has been added, this field will not be shown. We recommend you take a picture during installation for future reference.
Detailed chart
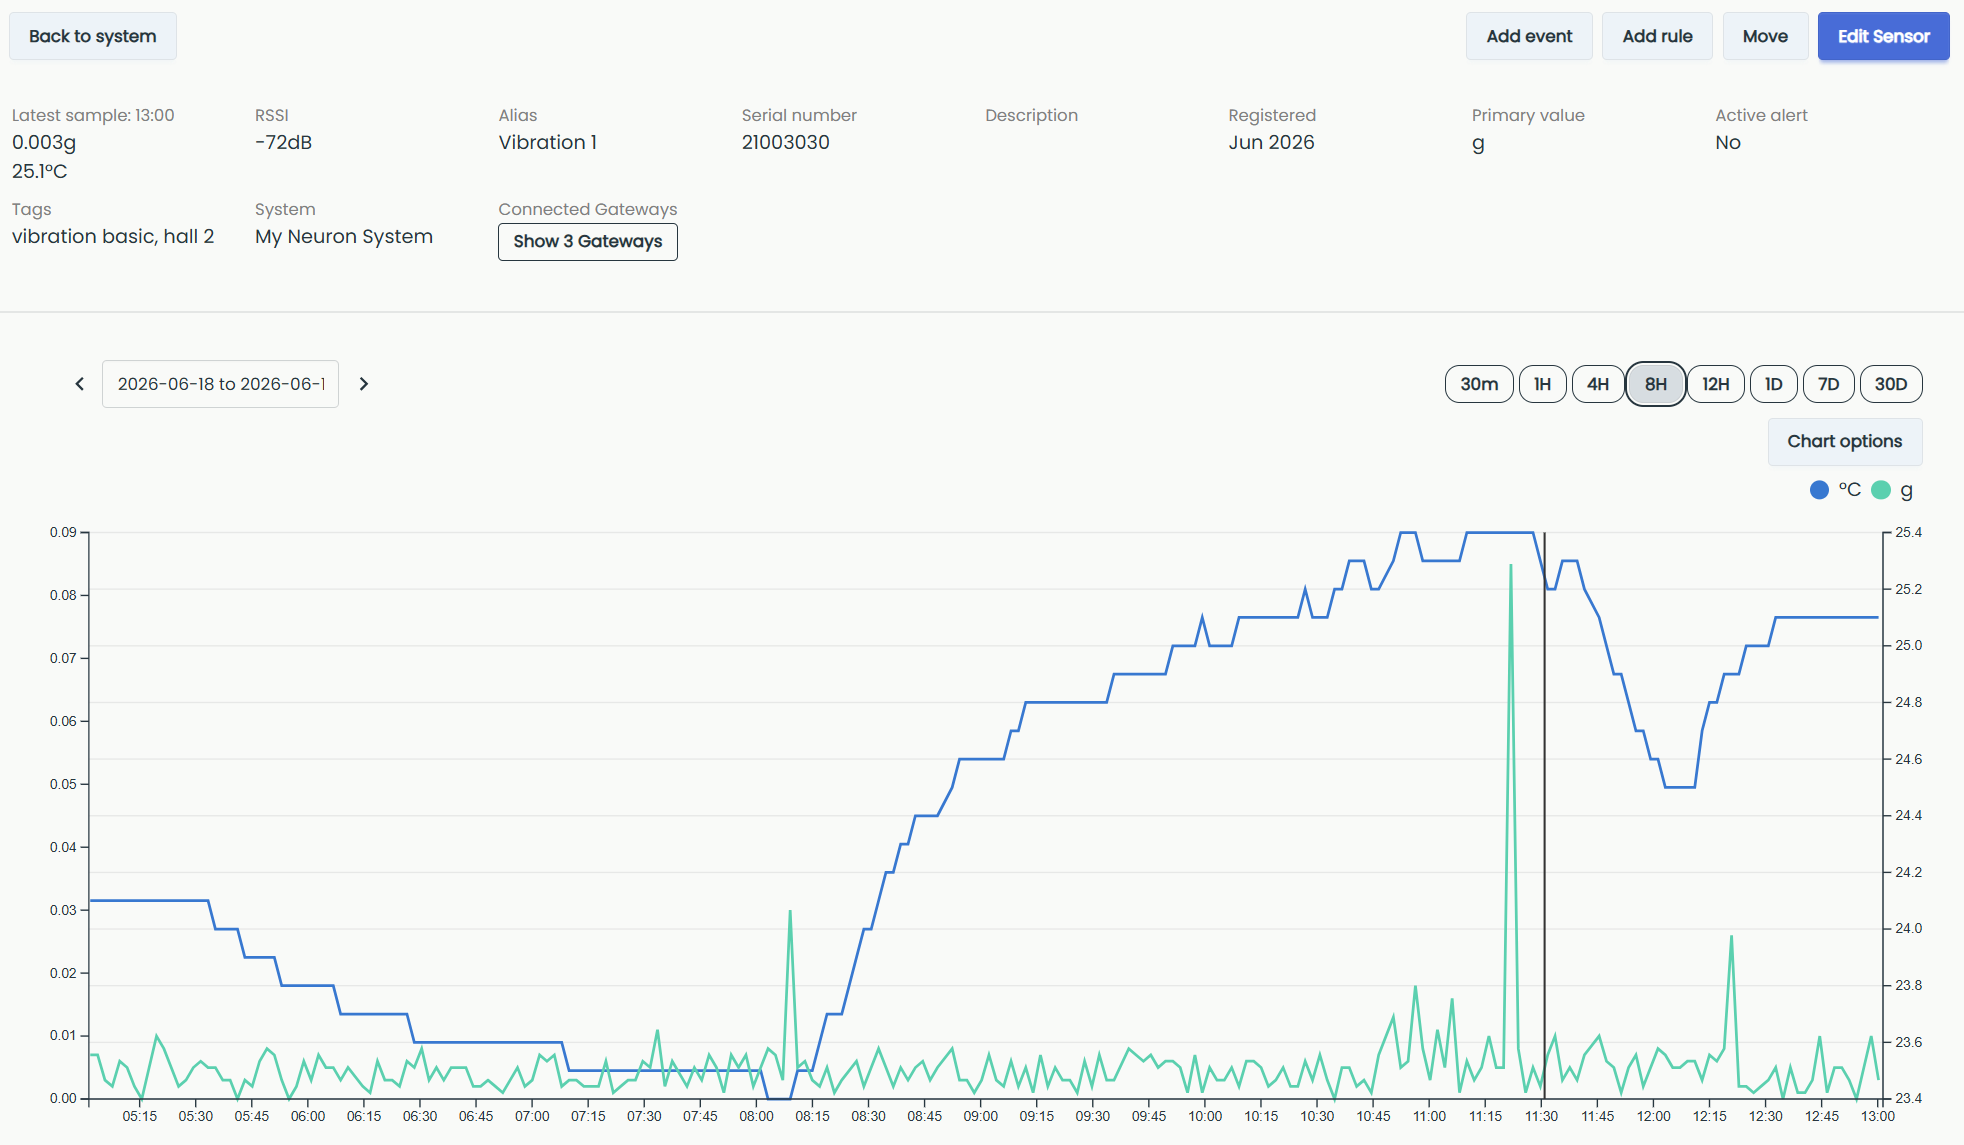
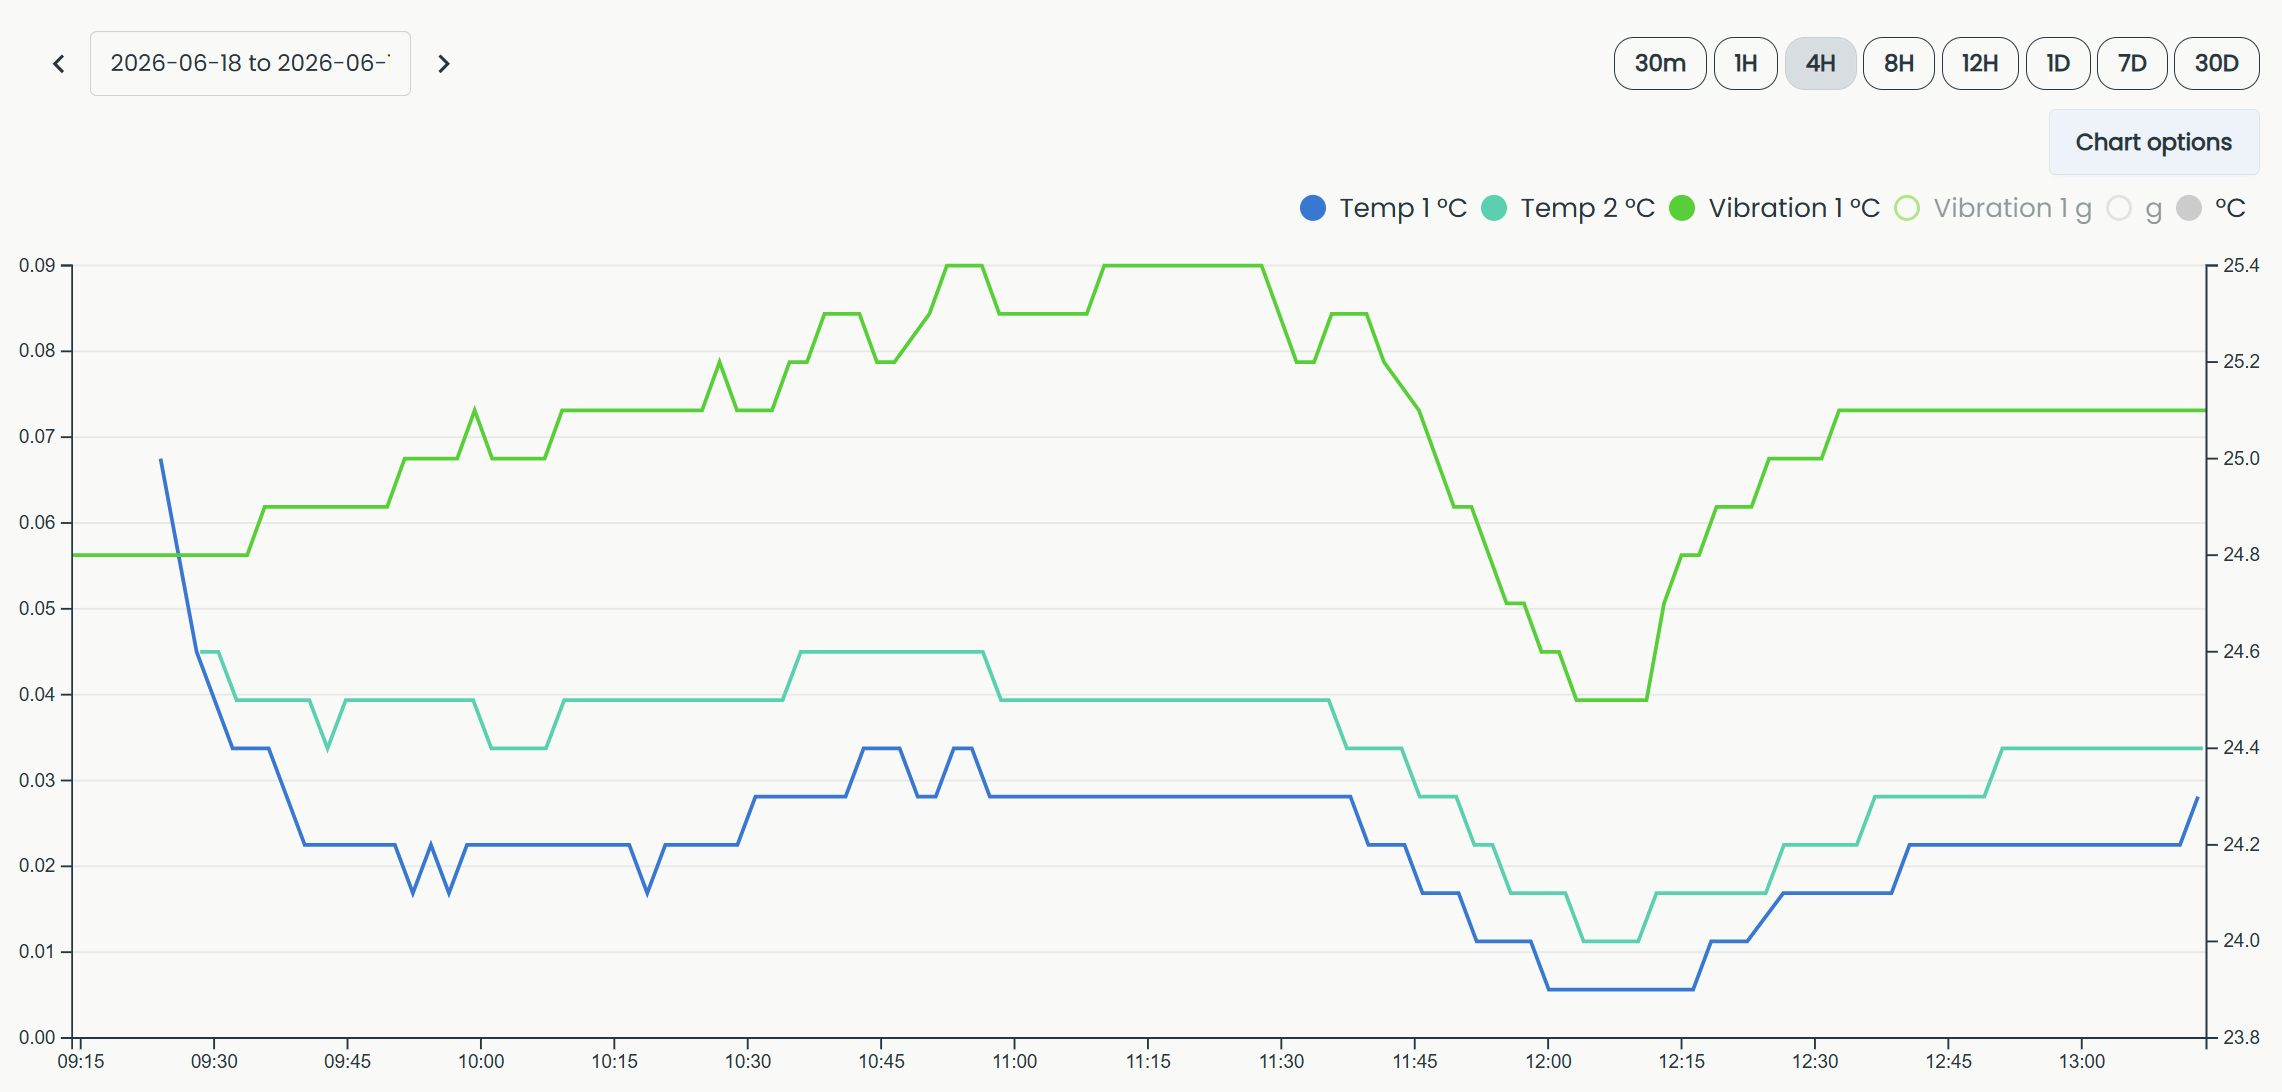
This is the detailed chart view of the sensor data. Default view is hourly averages of the last 24 hours. You can use the predefined time intervals to easily switch to a different time interval. Check the User settings for adjusting these predefined intervals.
You can also set the start and end time manually using the date selector, or use the mouse pointer to zoom in on a selected time frame.
.png)
If there is information you don't want to see in the detailed chart, unselect by clicking its value label.
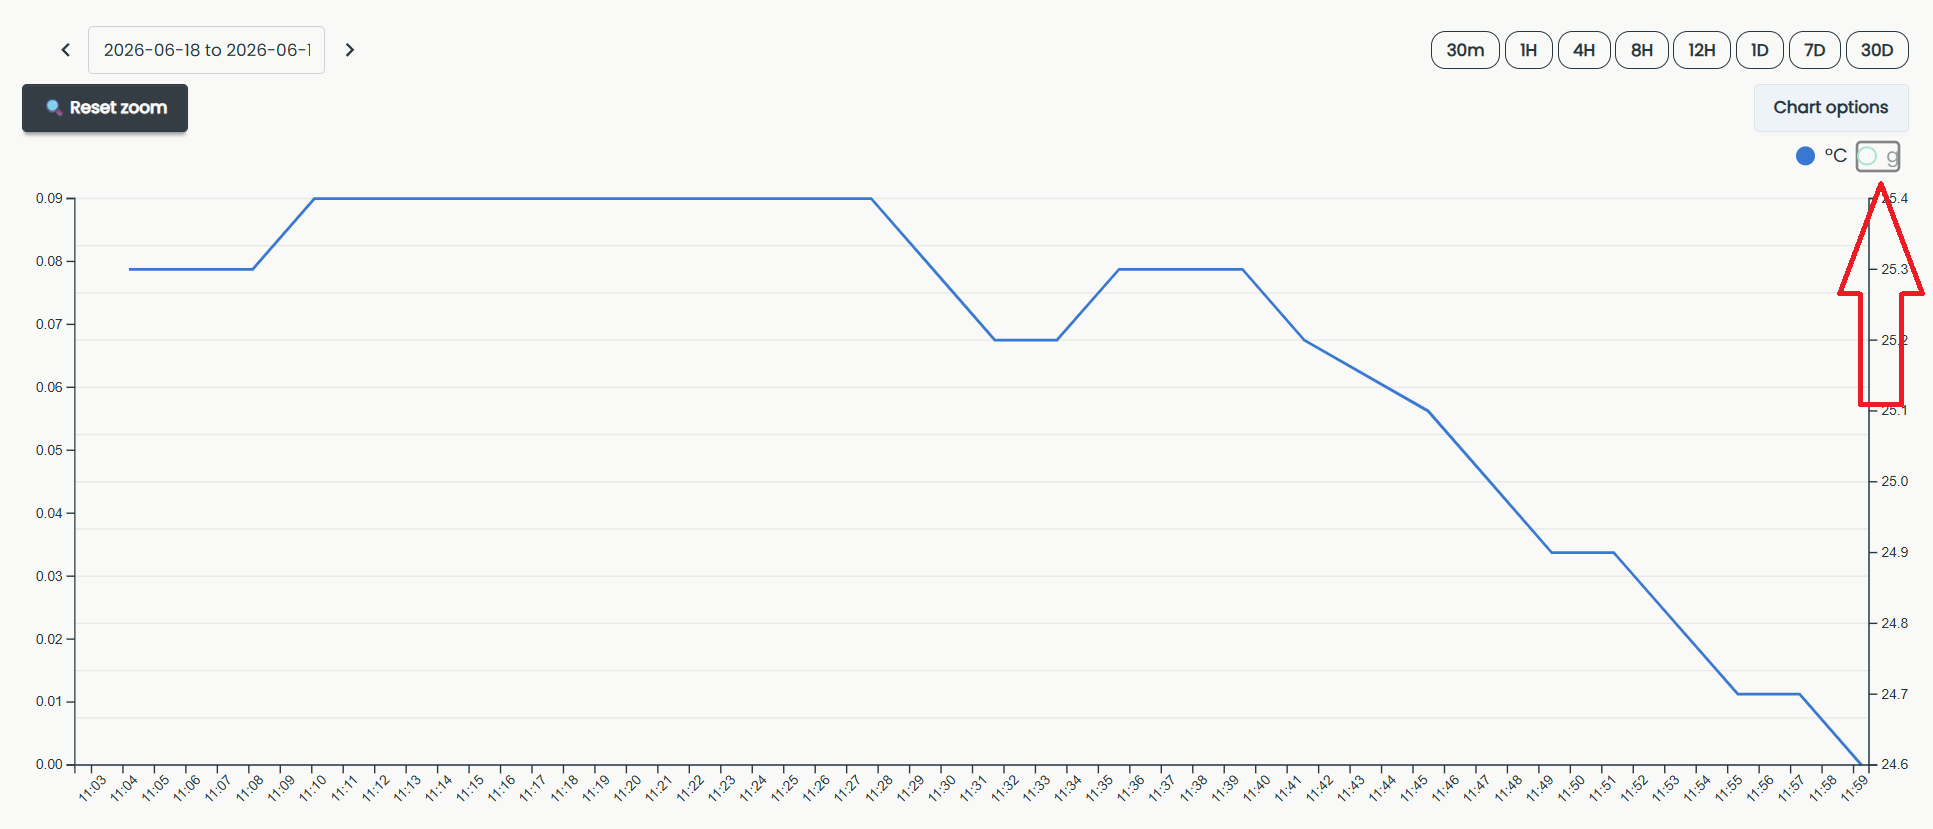
Chart options
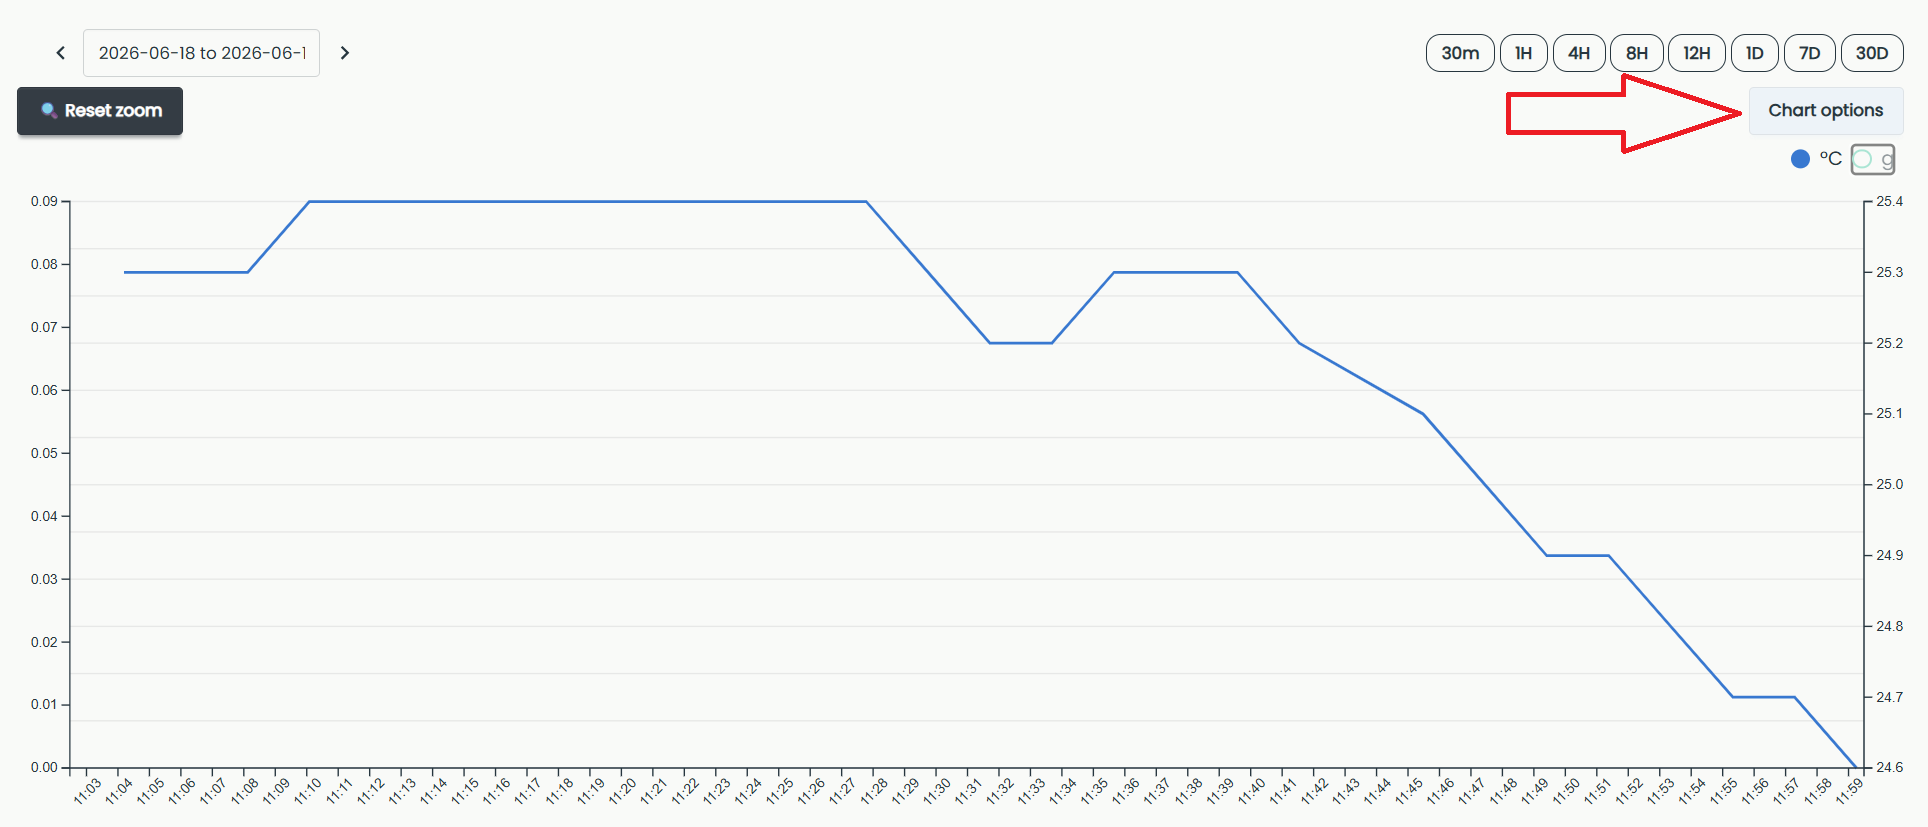
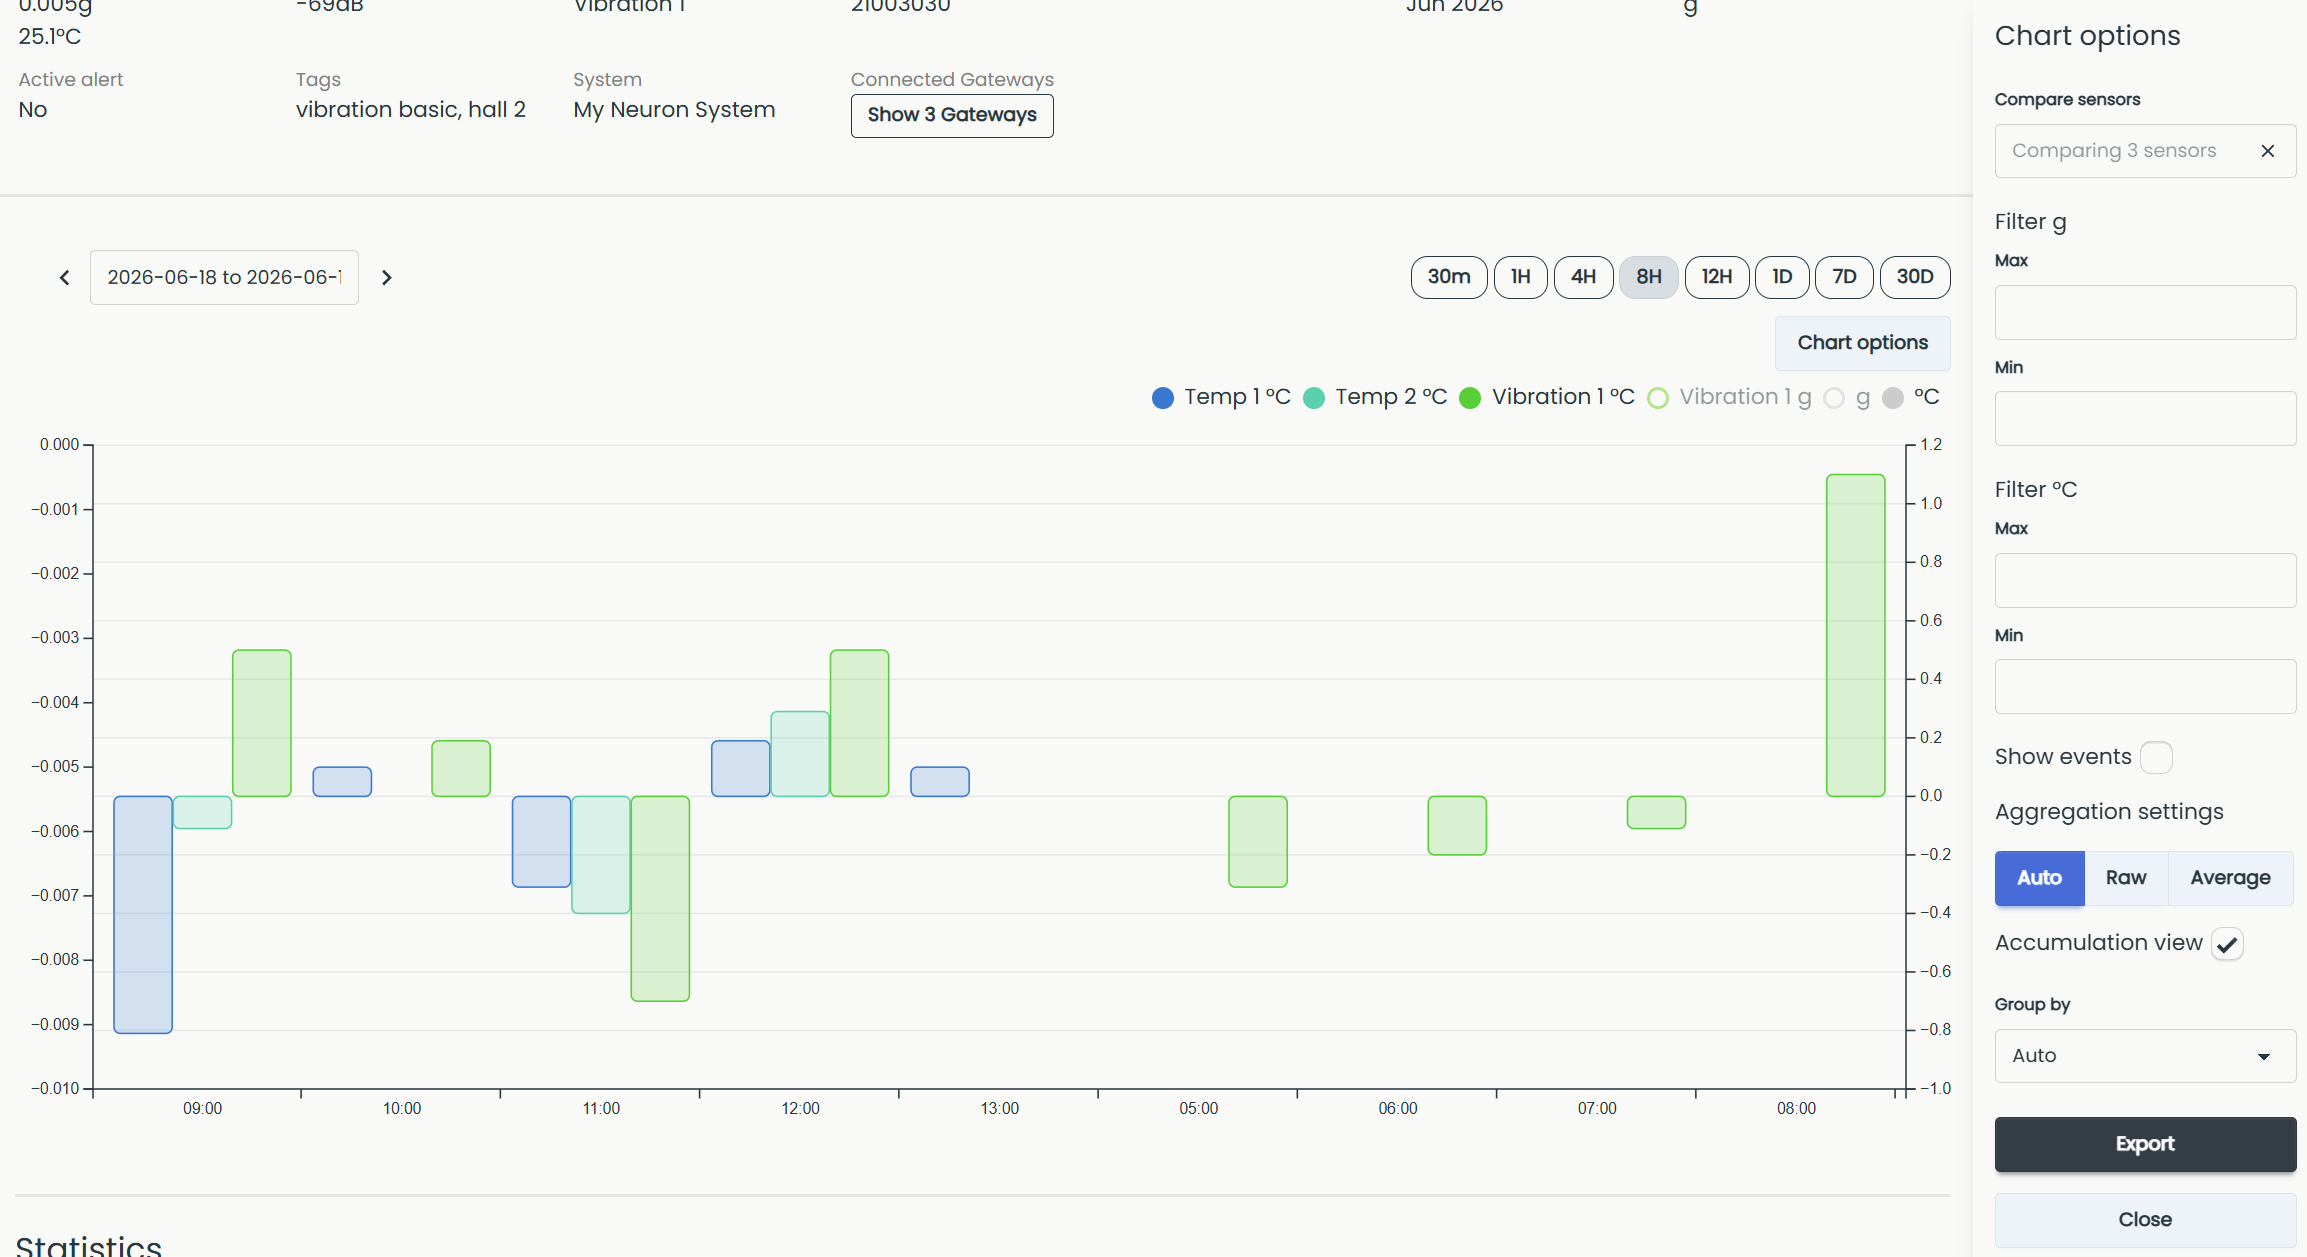
Compare sensors: Plot one or more sensors onto the same chart
Filter Max/Min: Only display data within the window defined by max/min
Show events: Displays events at points in the graph where rules triggered
Aggregation settings: Choose how data is aggregated (Auto, Raw or Average)
Accumulation view: Displays data in a bar chart
Export: Exports a CSV file of raw or average data
Comparing sensor values.
Accumulation view
Check the "Accumulation view" box to display bar charts. You can also select the time span (Group by) for each bar to customize the resolution.
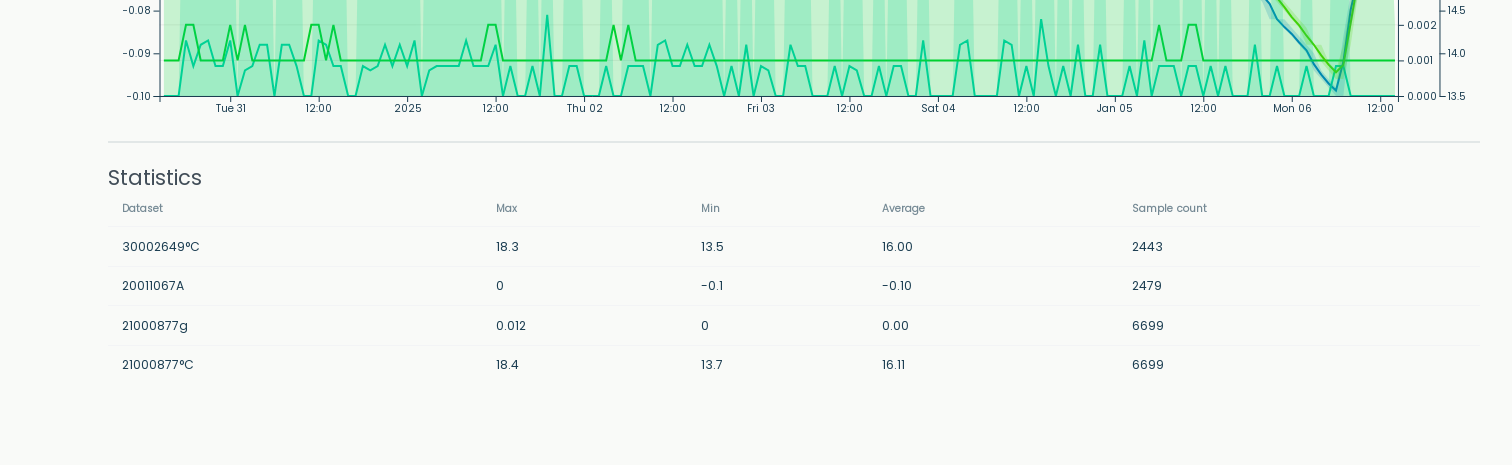
Statistics
Below the chart there is a table summarizing the visible data in the chart, giving you a quick overview of each device. For every dataset it shows the "Max", "Min" and "Average" value, along with the "Sample count" (the number of data points in the selected time range). Because the table reflects only the visible data, it updates whenever you change the time range or zoom.
Export data
Click the "Export" button in Chart options to export the sensor values to a .csv file. The data is exported in the format selected under "Aggregation settings": either "Raw" or "Average".
If the formatting is wrong after opening the file in Excel, try to open Excel first and import the data by selecting "From text/CSV" in the "Data" tab.
CSV is a simple file format used to store tabular data, such as a spreadsheet or database. Files in the CSV format can be imported to and exported from programs that store data in tables, such as Microsoft Excel or OpenOffice Calc.